
Alt coin Analysis: NEO, EOS, LTC and IOTA
We expect a short to medium term alt coin recovery and considering these set ups, I recommend buying LTC, Lumens and NEM.
Reason? The depreciation has been rapid and right now, these pairs are recovering at key Fibonacci or price action support levels.
Let’s dissect these charts:
Scalp Lumens and target $0.7
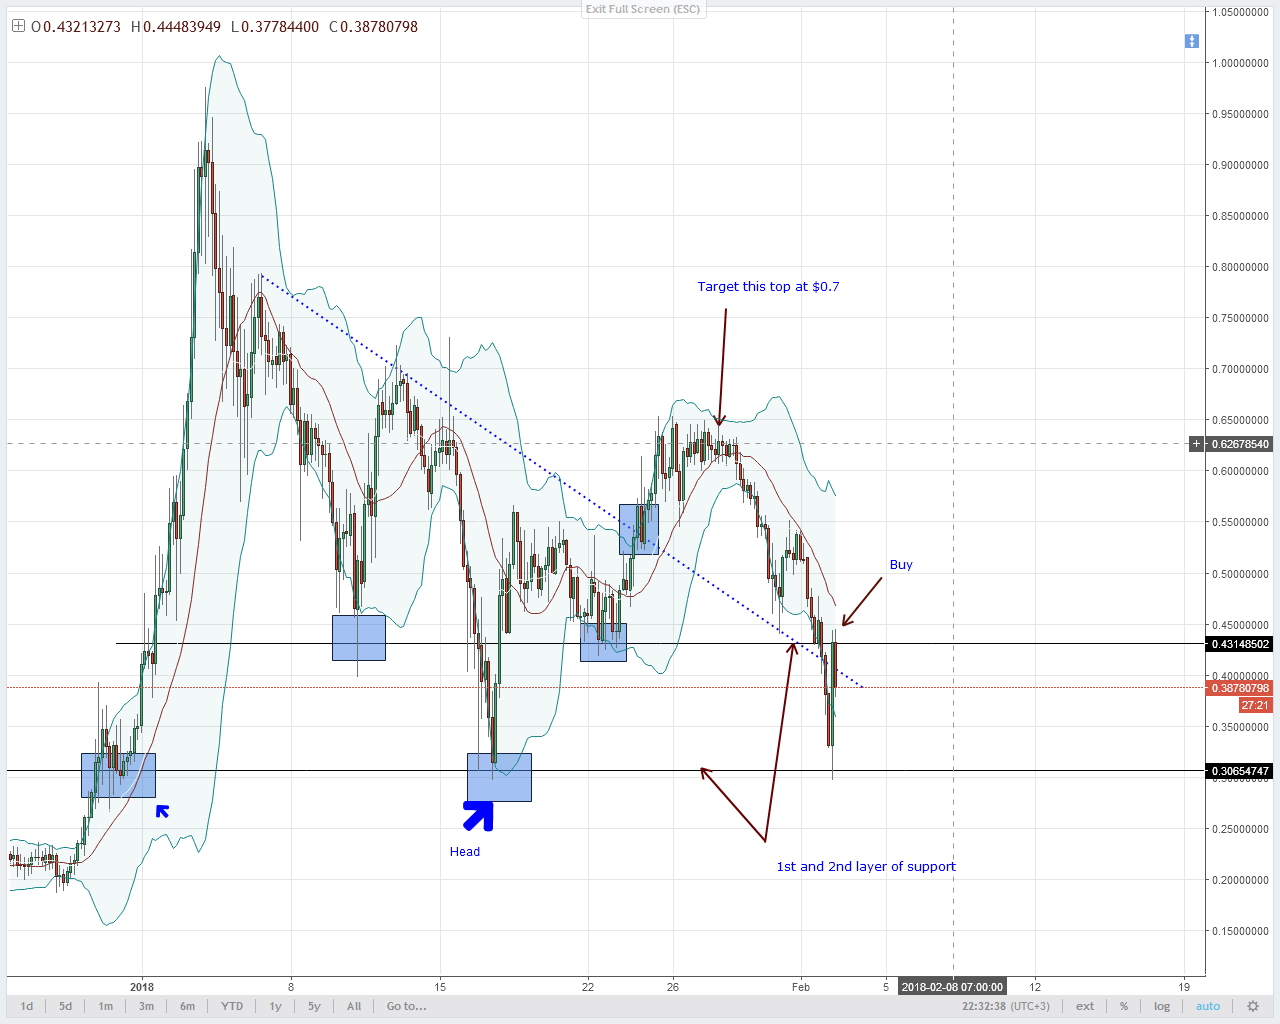
It’s pretty nice price action is reversing from the head of the previous inverted head and shoulder pattern.
While the general XLM sentiment is bearish, buyers can find some momentum especially if prices break and close above the minor resistance trend line and the middle BB.
I recommend buys with immediate targets at $0.70.
NEM Recovers Right at Main Support
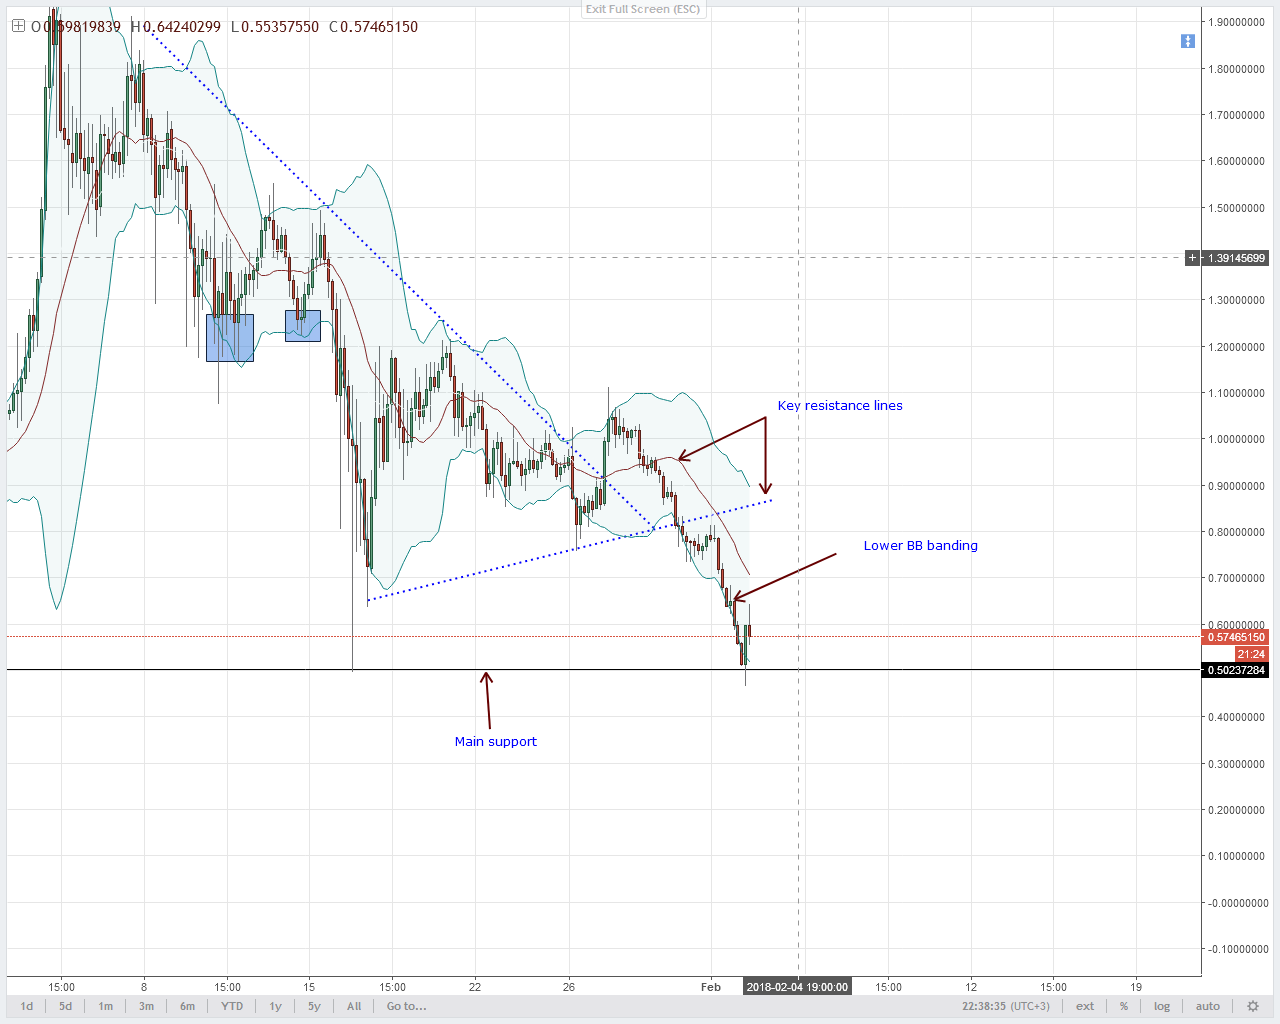
From yesterday’s price action, our NEM bear targets have been cleared and like most alt coins, prices are recovering.
I’m still pessimistic about this “bull” move but while at it, I recommend buys with targets at $0.75 as I wait to see what happens at those resistance levels.
Of course if there is a surge, I shall move my stops to break even and enjoy the ride towards $1.14.
EOS Bounces from $9
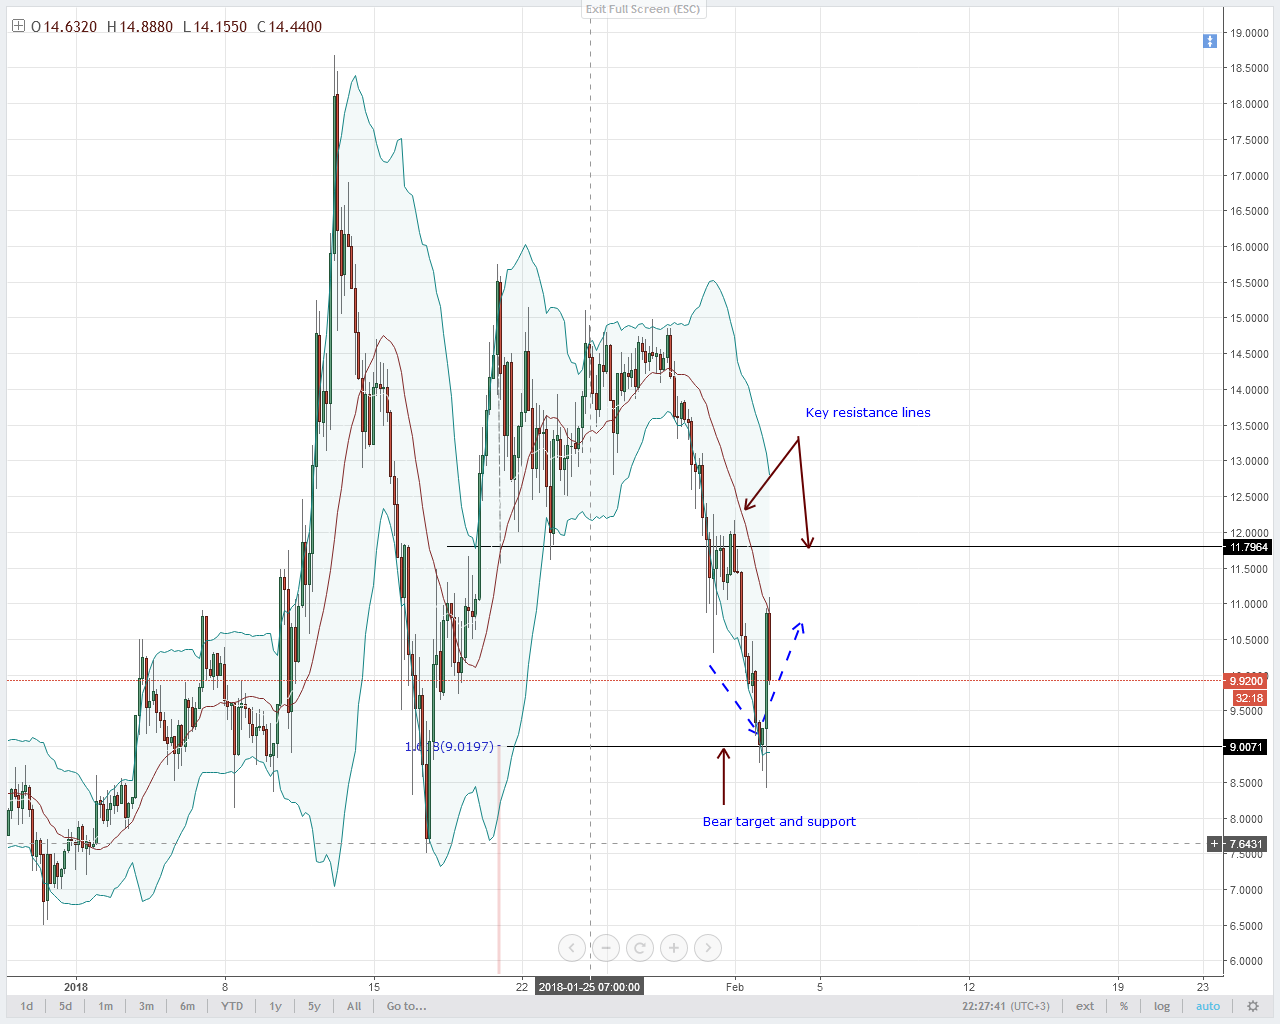
Laser surgery and we should keep our EOS strategy as per yesterday’s recommendation.
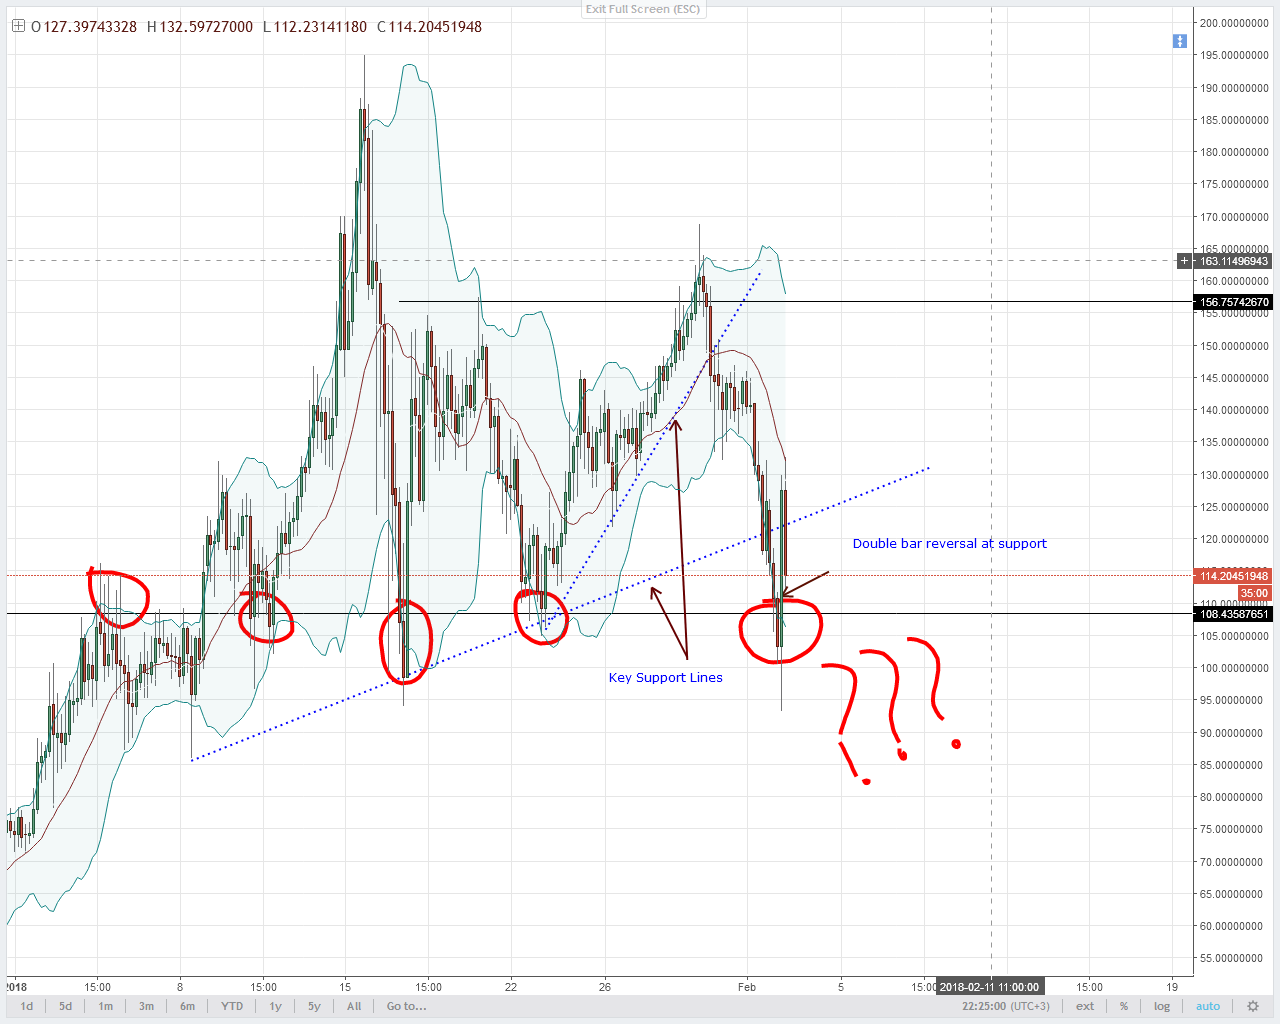
Buy LTC
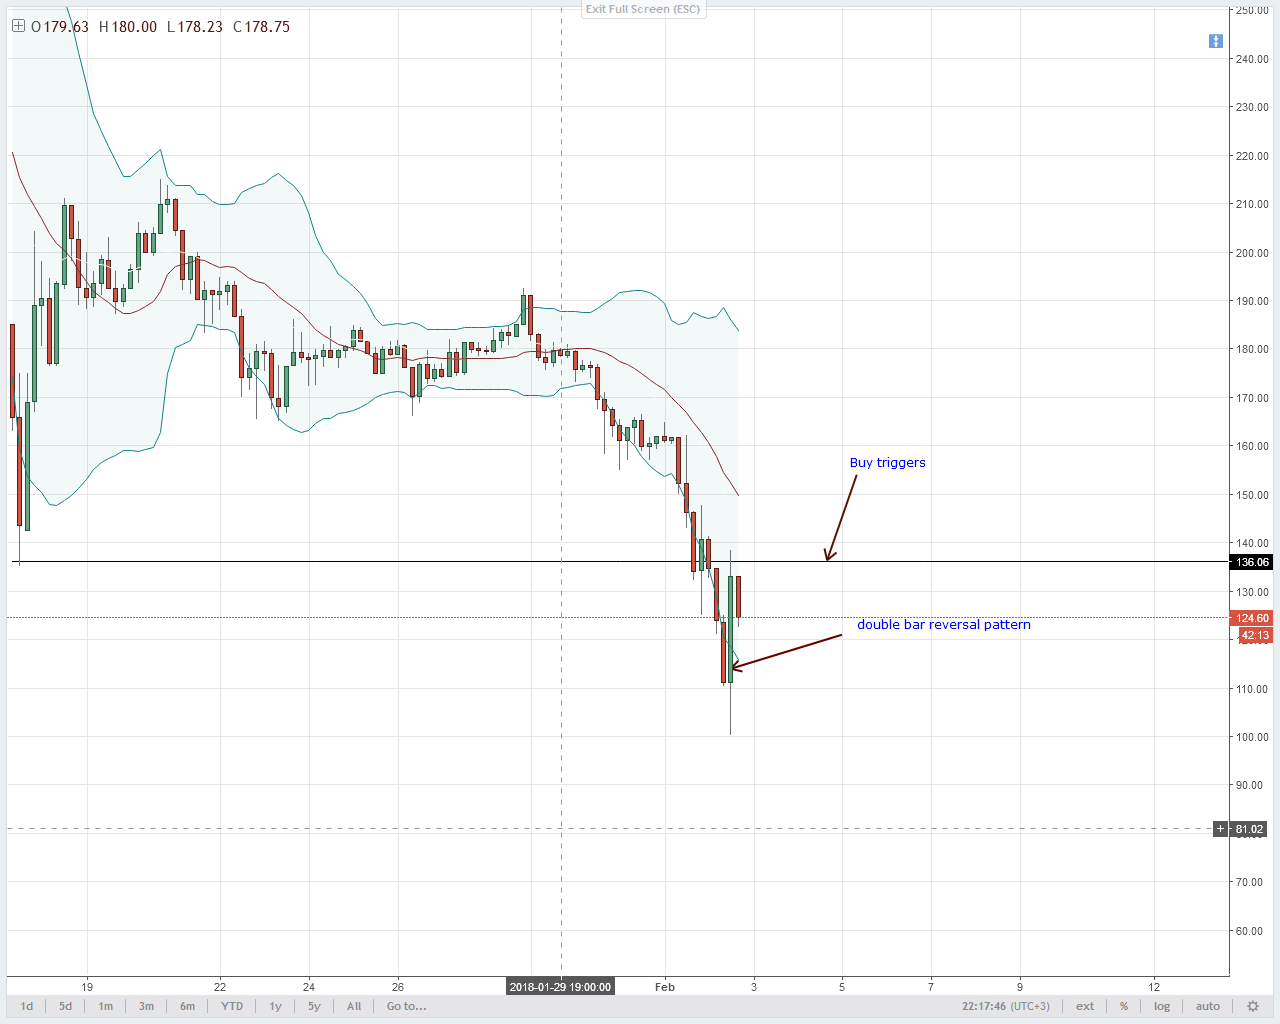
Undoubtedly, will all the FUDs and drama and regulation talks, it’s time to buy the coin.
History cannot change and referring to previous price action, fear is at the peak. while investors and pundits continue with their barrage, prices are bottoming up and syncing at fair prices.
In the 4HR chart, not only did prices react at $100 but a strong bullish engulfing pattern is right at the 78.6% Fibonacci retracement level.
Encouragingly, prices are also reversing from last year’s break out line and I can say the second phase of a major bull break out pattern is complete. I recommend buys when LTC prices close above $140.
NEO Back in Consolidation
In a flash, NEO prices dropped below the 50% retracement line in the daily chart but buyers managed to shore this prices.
Even though there is a humongous bullish candlestick in the 4HR chart, we shall maintain our bearish view until prices touch or even close below the 61.8% Fibonacci retracement in the daily chart.
If indeed there is a welcomed reversal, then price action or buyers must lead the way and remove any nestles along the way as they drive prices above the middle BB.
Otherwise, I recommend shorting on every high.
All charts courtesy of Trading View
The post Alt coin Analysis: NEO, EOS, LTC and IOTA appeared first on NewsBTC.