Bitcoin Price Analysis: Bitcoin Sees Lower Lows as It Drops Below Historic Support

Over the last couple months, we’ve been tracking a potential Distribution Trading Range at the top of bitcoin’s market cycle. Today, we have received higher confidence that bitcoin may have topped out. At around 3:00 p.m. EST, bitcoin broke through the bottom of the trading range and is now seeing aggressive selling as long positions begin to close and short positions begin to open. Today marks the first day of lower lows since bitcoin topped out around $20,000:
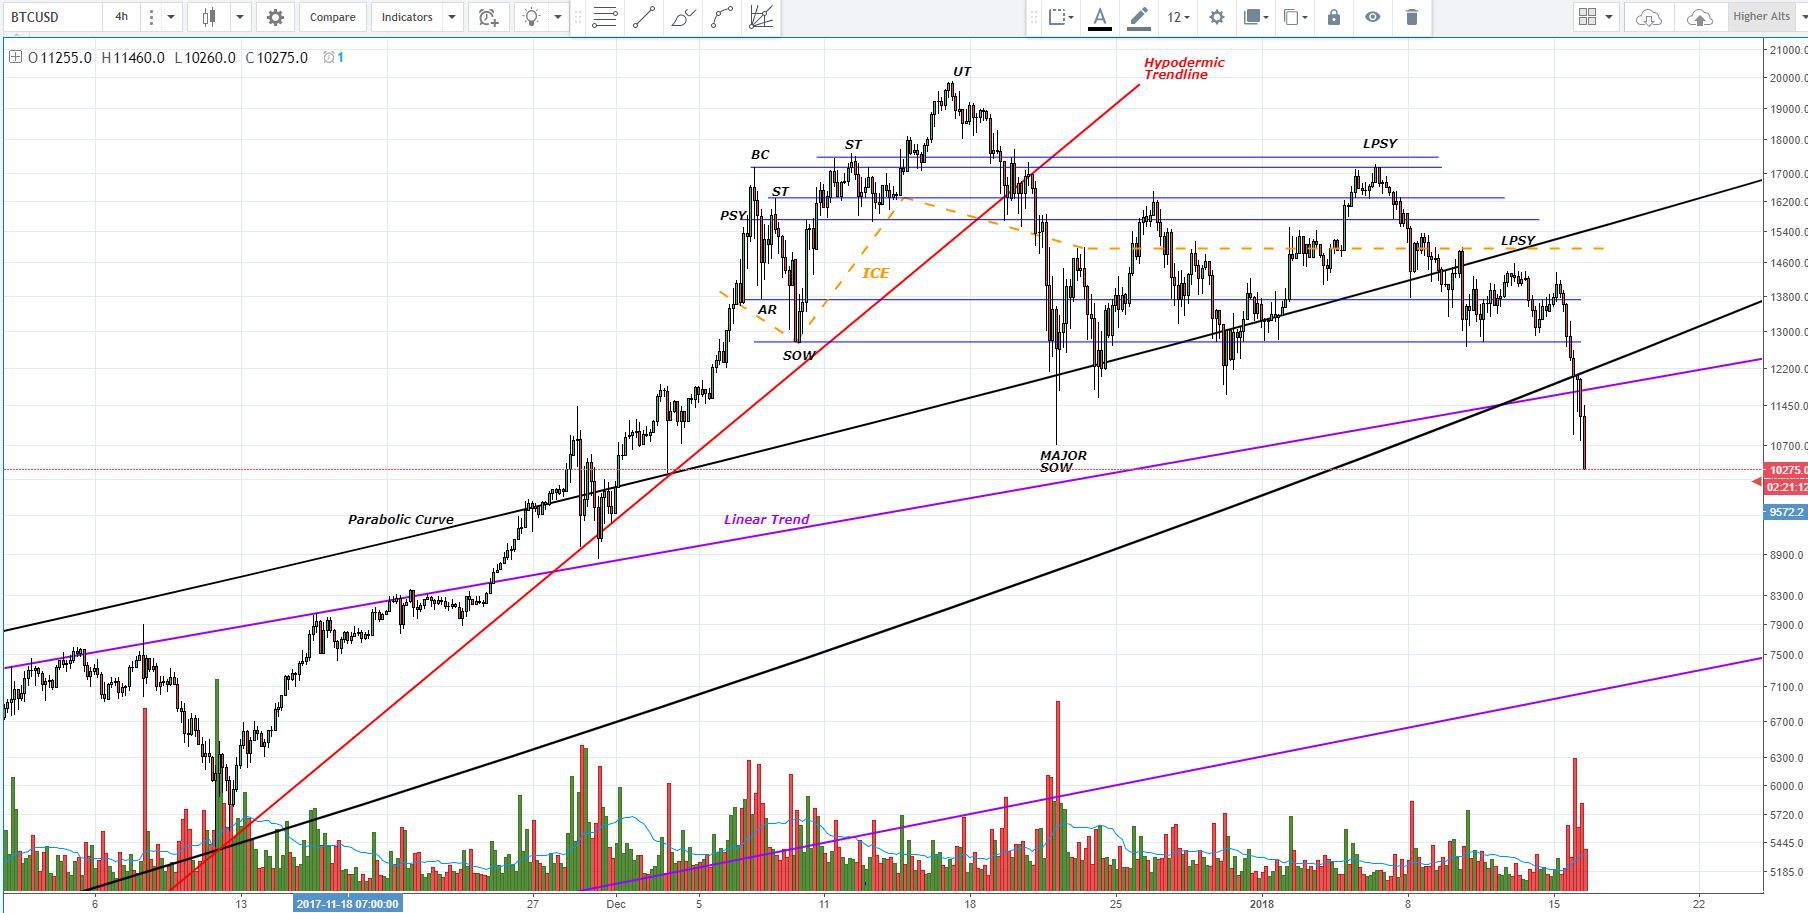 Figure 1: BTC-USD, 4-Hour Candles, Distribution Trading Range
Bitcoin managed to blow through several milestones including both the parabolic and the linear trends. The linear and parabolic trends have been guiding trends for the last three years, and today bitcoin has broken parabolic support. It could get ugly:
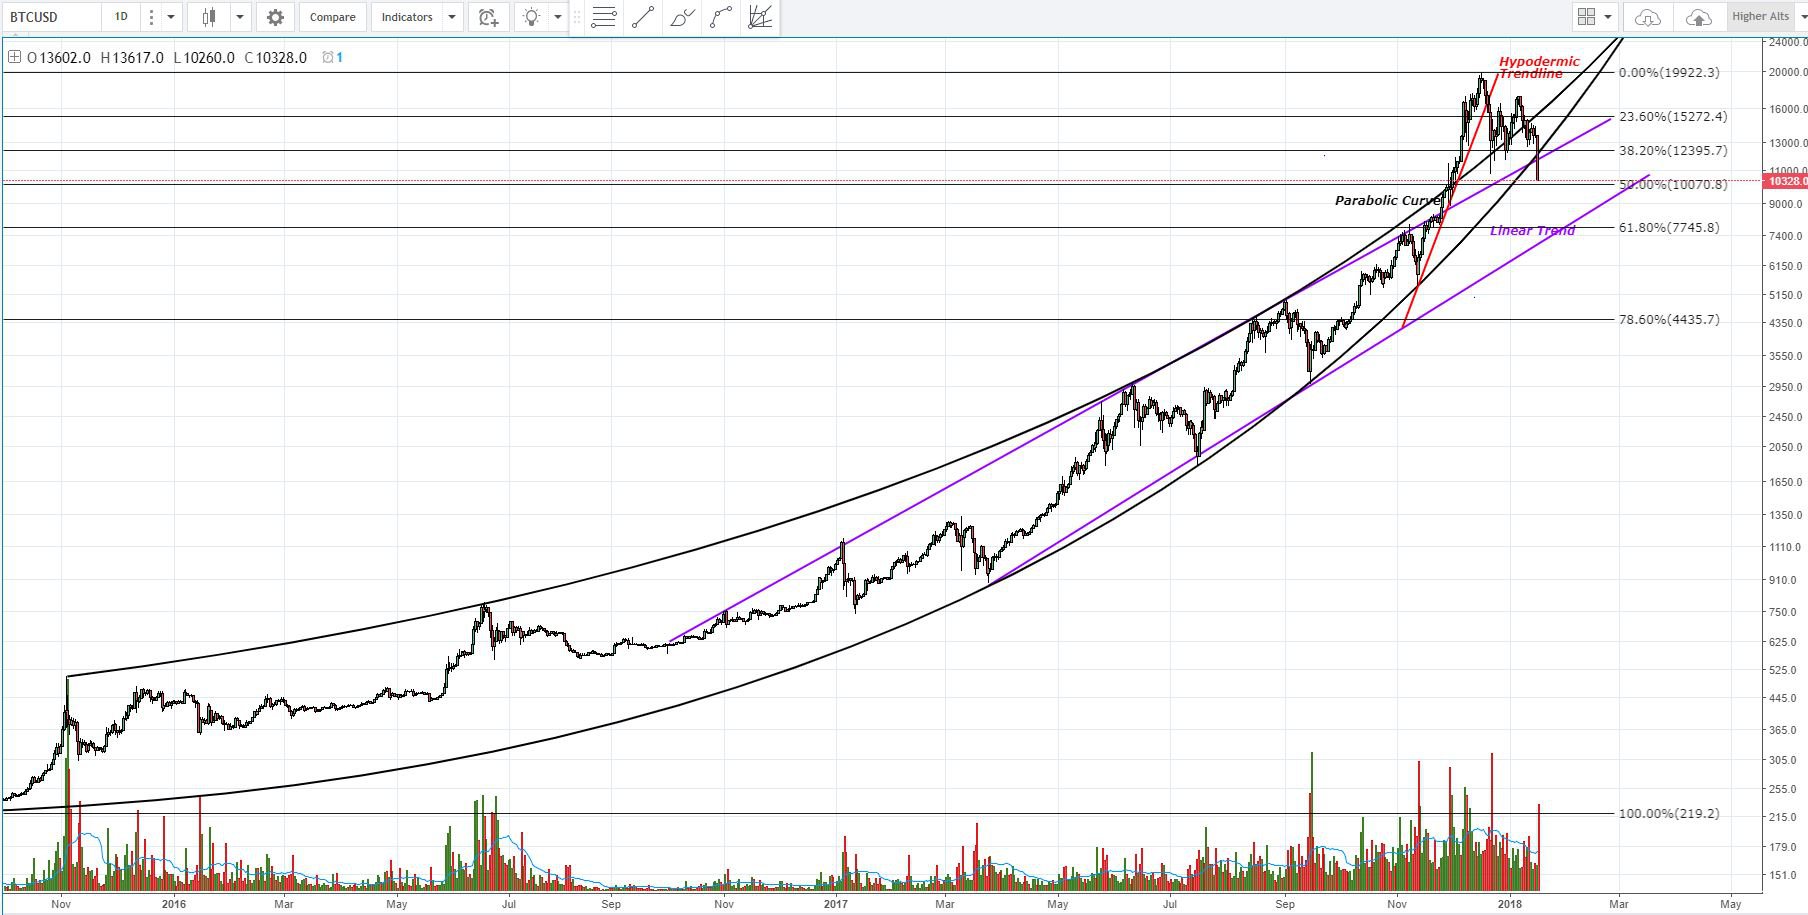 Figure 2: BTC-USD, 1-Day Candles, Macro Trend
What was once strong support has now become resistance as bitcoin scrambles to find a bottom. We can see quite clearly there is a line of support around $10,000 where the macro Fibonacci retracement values for the 50% retracement line exist. Any downward continuation will likely be supported in the interim. However, it’s fair to say that bitcoin is beginning a new downward trend. As stated earlier, today marks the first day of lower highs and lower lows — i.e., a downtrend.
So where does the bottom lie? That remains to be seen. What is clear, however, is that there was a systematic distribution of bitcoin from large players to the masses; and now we are beginning the next phase of the market cycle — the markdown phase. Will it be a sustained markdown? It’s too early to tell at the moment, so we will have to play it by ear.
Bitcoin is a long-time fan of violent drops and violent bounces, so it’s unclear how this downtrend will terminate. For now, I highly recommend traders stay away from smaller time frames and focus more on the macro view of things.
As we come to test the macro 50% retracement values, it’s important to view how the market responds and see how the volume reacts. If we don’t see strong follow-through on a bounce from the 50%, there could be a strong bearish continuation in its future. Volume is your friend and confirms the trend. If you don’t see strong volume following an upward bounce, it’s entirely possible you could get stuck in a bull trap — and no one wants that.
Bull traps are designed to lure aggressive bulls into long positions prematurely to create liquidity for the bearish investors in the market. If you are unsure of what direction the market is moving, there is nothing wrong with sitting out.
Summary:
-
A potential markdown phase is under way as bitcoin sees aggressive selling pressure.
-
Today marks the first day of lower lows in weeks and marks a potential macro downtrend.
-
Support will likely be found at the $10,000 values, which coincide with the 50% macro Fibonacci retracement values.
Trading and investing in digital assets like bitcoin and ether is highly speculative and comes with many risks. This analysis is for informational purposes and should not be considered investment advice. Statements and financial information on Bitcoin Magazine and BTC Media related sites do not necessarily reflect the opinion of BTC Media and should not be construed as an endorsement or recommendation to buy, sell or hold. Past performance is not necessarily indicative of future results.
This article originally appeared on Bitcoin Magazine.