Bitcoin Price Analysis: Bitcoin Tests Parabolic Trend After 25% Weekly Growth

Over the last 7 days, bitcoin has seen further, rapid growth as it manages to squeeze a $2,000 rally leading into its current all-time high in the $9700s — a staggering 25% growth in 7 days. As discussed in previous bitcoin market analyses, the bitcoin market has progressed in a parabolic envelope:
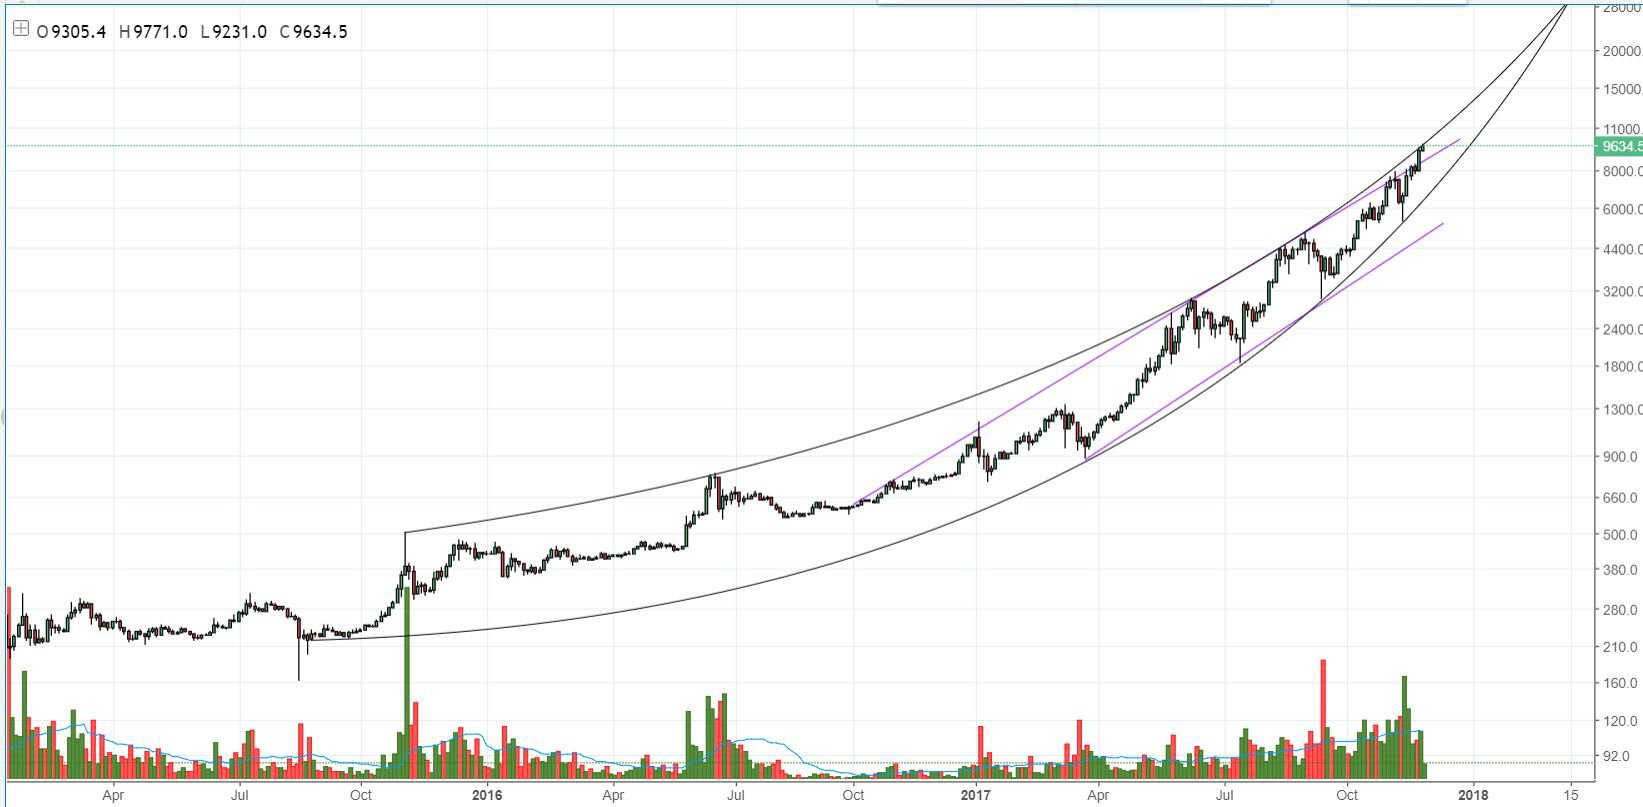 Figure 1: BTC-USD, 1 Day Candles, Macro Parabolic Envelope
As of the time of writing this article, the current bitcoin market has broken its linear channel (outlined in purple) and is now testing the upper boundary of the parabolic envelope. As we approach the end of the parabolic envelope, the swings in price will become more sudden and more severe as the market attempts to remain within the constraints of its parabolic trend.
As the upper limit of the parabolic trend advances, the lower limit also advances. Currently, all eyes are on this parabolic trend as individuals are trying to time the top of the market only to have their positions liquidated time and time again. It’s never advisable to try and time the top of a parabolic market because the upper boundary that confines the market is growing in a parabolic fashion.
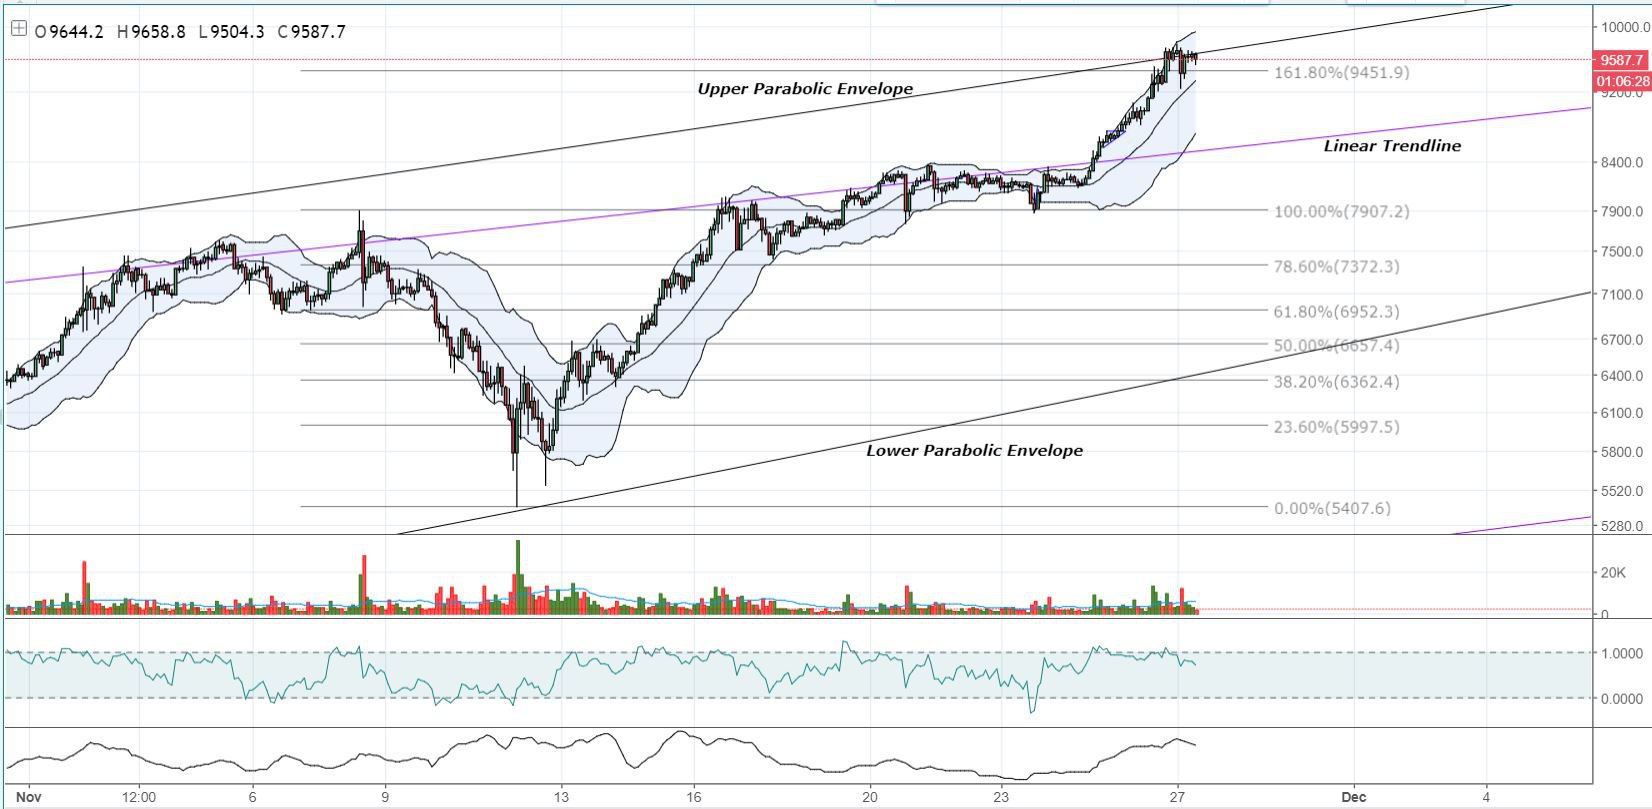 Figure 2: BTC-USD, 2 Hour Candles, Micro Trend
Figure 2 above shows a closer view of both the parabolic and linear trendline outlined in Figure 1. This image shows a textbook, 161% Fibonacci Extension from the previous all-time high where it ultimately found resistance on the parabolic envelope. The move that led to the current all-time high was sudden and doesn’t offer much support below the current values. If bitcoin retraces, we can expect support to line on the linear trendline outlined in purple, and the 100% retracement values in the $7900s.
However, if bitcoin manages to break these parabolic trend values and find support or continue upward, bitcoin could see prices as high as $12,000 (the next set of fibonacci extension values). It should be noted that a breaking of this parabolic envelope would mark a breakout of the 2.5 year long parabolic trend outlined in Figure 1. To date, we have yet to break above the parabolic envelope.
Historically, when bitcoin encounters the parabolic trendlines, the market sees either a bearish reversal (if touching the upper curve) or a bullish reversal (if touching the lower curve). Right now, bitcoin is still in the waiting period as the market decides what the next move will be.
Summary:
-
Bitcoin saw 25% market growth in the last week.
-
The market is currently testing the upper boundary of a 2.5 year long parabolic growth curve. Historically, this has lead to a market reversal that sends the price downward to test the lower parabolic curve.
-
A breakout of the parabolic envelope could send the bitcoin market into the $12,000s.
Trading and investing in digital assets like bitcoin and ether is highly speculative and comes with many risks. This analysis is for informational purposes and should not be considered investment advice. Statements and financial information on Bitcoin Magazine and BTC Media related sites do not necessarily reflect the opinion of BTC Media and should not be construed as an endorsement or recommendation to buy, sell or hold. Past performance is not necessarily indicative of future results.
The post Bitcoin Price Analysis: Bitcoin Tests Parabolic Trend After 25% Weekly Growth appeared first on Bitcoin Magazine.