Bitcoin Price Analysis: Bitcoin’s All-Time High Tests a Historic Reversal Point

For months on end, BTC-USD had a strong bullish rally that has been well confined between both a linear ascending channel and (on a macro scale) a parabolic curve:
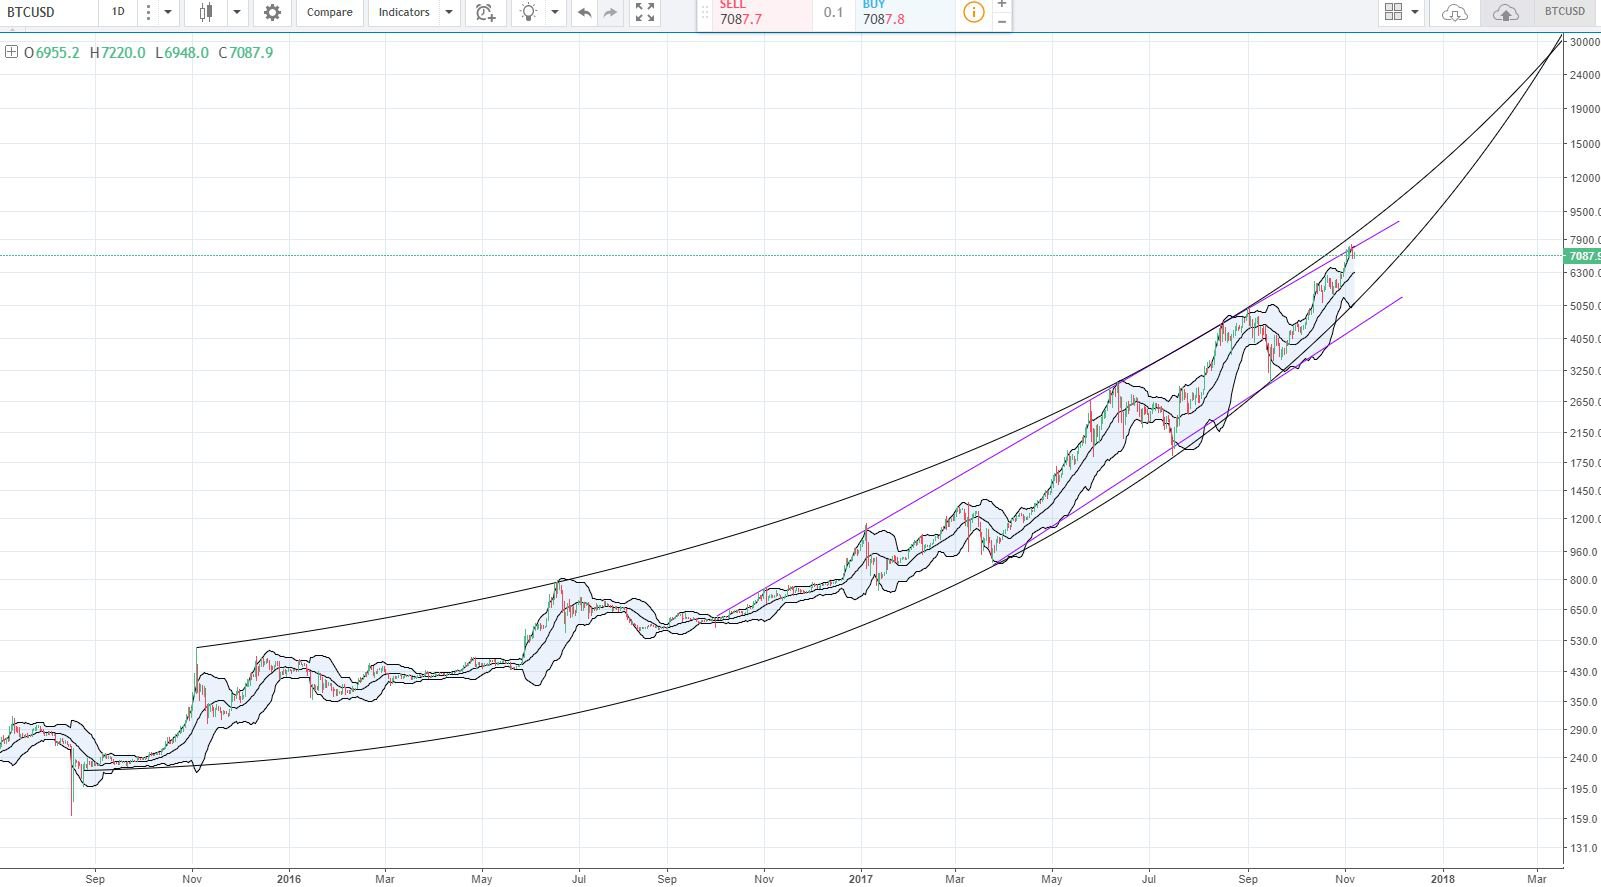 Figure 1: BTC-USD, 1-Day Candles, Linear and Parabolic Trendlines
After a very strong, bullish rally, bitcoin managed to settle on a new all-time high in the $7,500s. This price peak bounced right off the upper linear ascending trendline shown in Figure 1. Historically, every time bitcoin has touched the upper ascending trendline, the market has gone through a corrective phase and entered into a relatively strong bearish reversal. At the time of this article, bitcoin is currently testing key, macro support of the lower $7,000 price range:
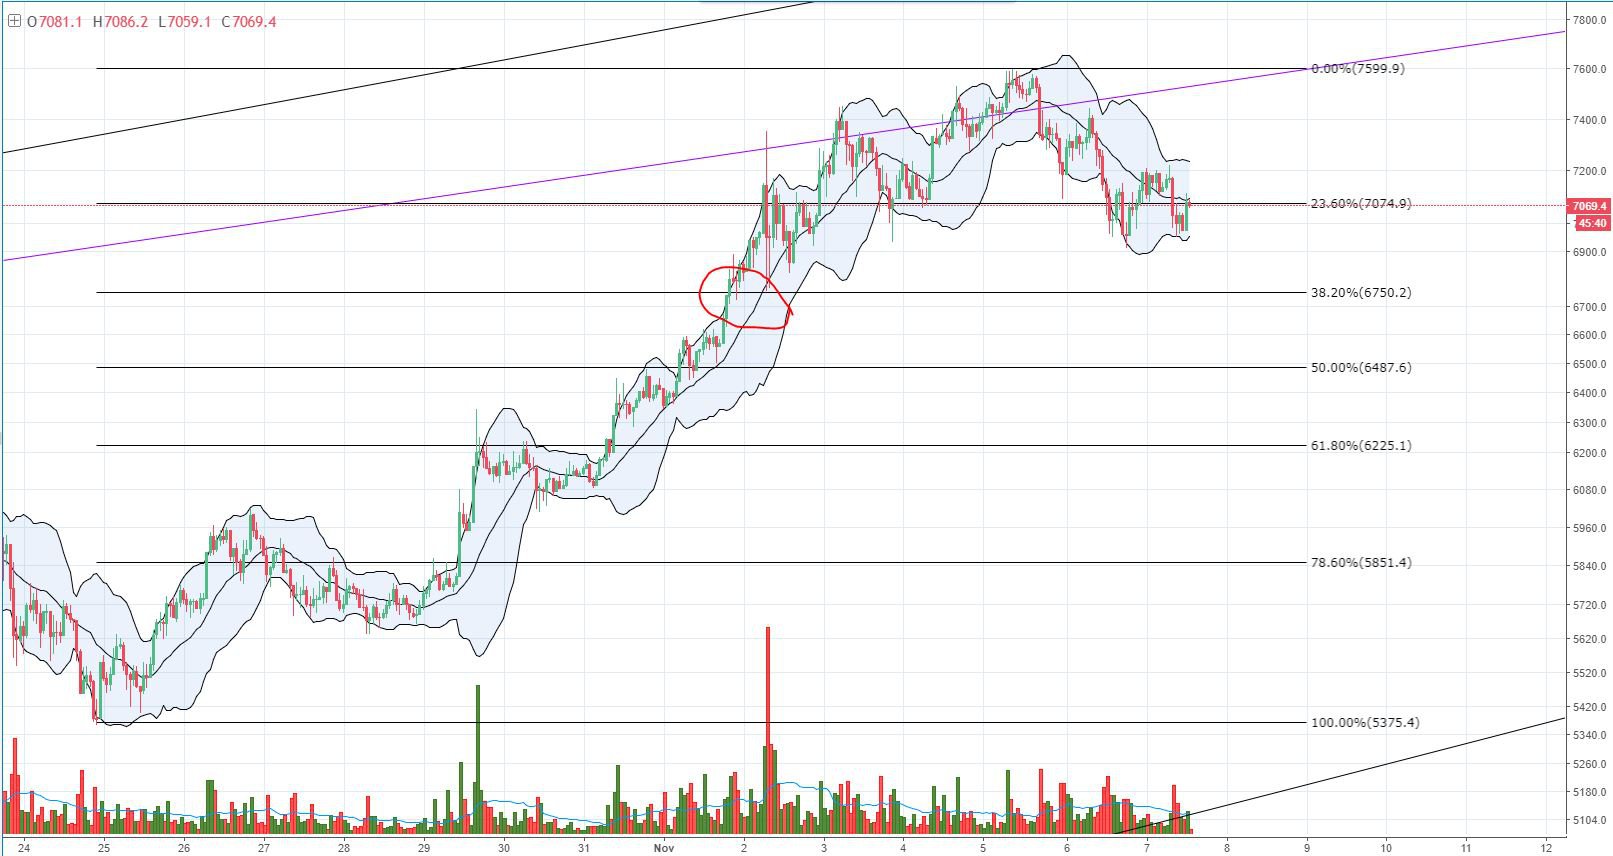 Figure 2: BTC-USD, 1-Hour Candles, Macro Support
The 23% Fibonacci support has been a point of interest in the market’s history and will prove to be strong support. BTC-USD has attempted to break this support level a couple of times already and we are currently making a third test. A break below this level of support could send the price down to the 38% retracement values and test the $6,700 prices. However, if we look at the previous price action (the red circle) that brought the price upward, we don’t see any consolidation or support in the market’s history. This tells us that the 38% price level most likely won’t prove to be significant support during a potential move downward and we can expect to find stronger support in lower values around the $6,400–$6,500 prices.
Historically, during correction periods, bitcoin has retraced 50–61% of the initial bull run:
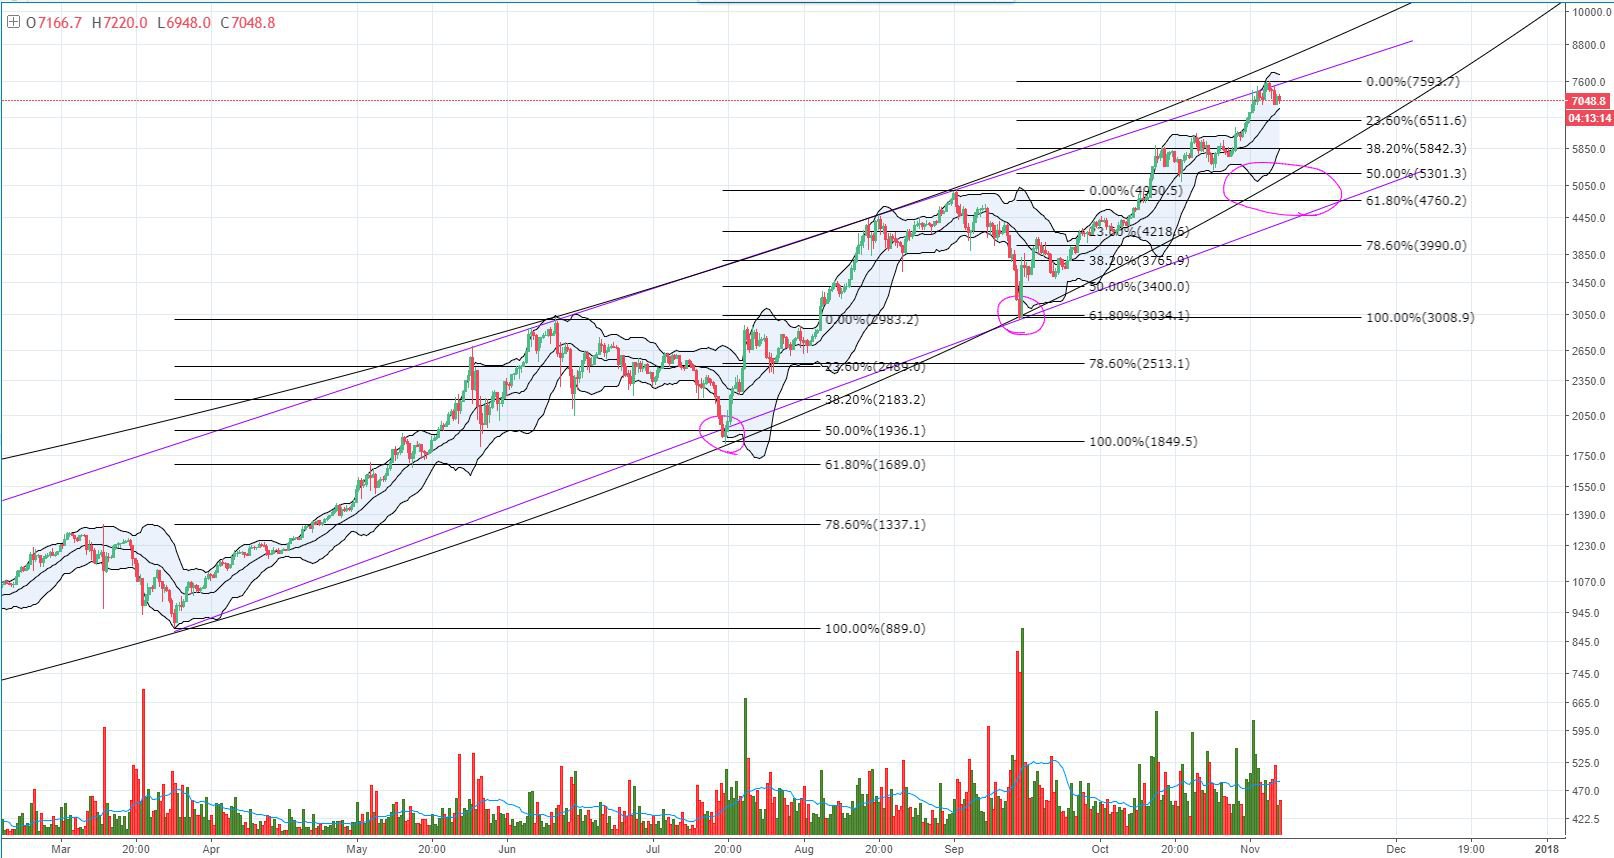 Figure 3: BTC-USD, 12-Hour Candles, Retracement Trend
The 50–61% retracement trend has formed a very nice, consistent ascending trendline for the lower support values. Unfortunately in this case, a retracement to the lower trendline would shove us outside the parabolic envelope described in the last bitcoin market analysis. On a macro level, if we do continue on a macro retracement to the 50–61% retracement values, we will likely find support on the lower parabolic curve in the $5,300s.
Overall, bitcoin appears to be experiencing a slow bleed and will likely continue until some buying pressure picks up on the market. In general, the bullish pressure is somewhat exhausted, and if there is a resumption of an uptrend, we will likely see support and bullish continuation off the 23% retracement and $6,500 values outlined in Figure 3.
Right now, bitcoin is in a precarious situation because it’s sitting just above support at the $7,000 level and doesn’t appear to have any interest in climbing back up just yet. Keep an eye on this support level and watch for a rise in volume on the next test of support. If we break this support level, it’s likely to continue downward for several hundred dollars before finding support once again.
Summary:
-
Bitcoin topped out its all-time high at the upper boundary of a macro, linear trendline.
-
Historically, a test of this trendline has prompted a market correction — it is likely that this trend will continue.
-
We are testing key support at the $7,000 price level and a move below this support will signal a continuation of the down trend.
Trading and investing in digital assets like bitcoin and ether is highly speculative and comes with many risks. This analysis is for informational purposes and should not be considered investment advice. Statements and financial information on Bitcoin Magazine and BTC Media related sites do not necessarily reflect the opinion of BTC Media and should not be construed as an endorsement or recommendation to buy, sell or hold. Past performance is not necessarily indicative of future results.
The post Bitcoin Price Analysis: Bitcoin’s All-Time High Tests a Historic Reversal Point appeared first on Bitcoin Magazine.