Bitcoin Price Analysis: BTC Markets Anemic After Initial BCH Trading

As discussed in the previous BTC-USD market analysis, the market has begun to test and retest known support and resistance lines on both the macro and micro levels. Since finding its local bottom around $1,800, BTC-USD has paved a fairly clean schematic of support and resistance levels along the Fibonacci Retracement values:
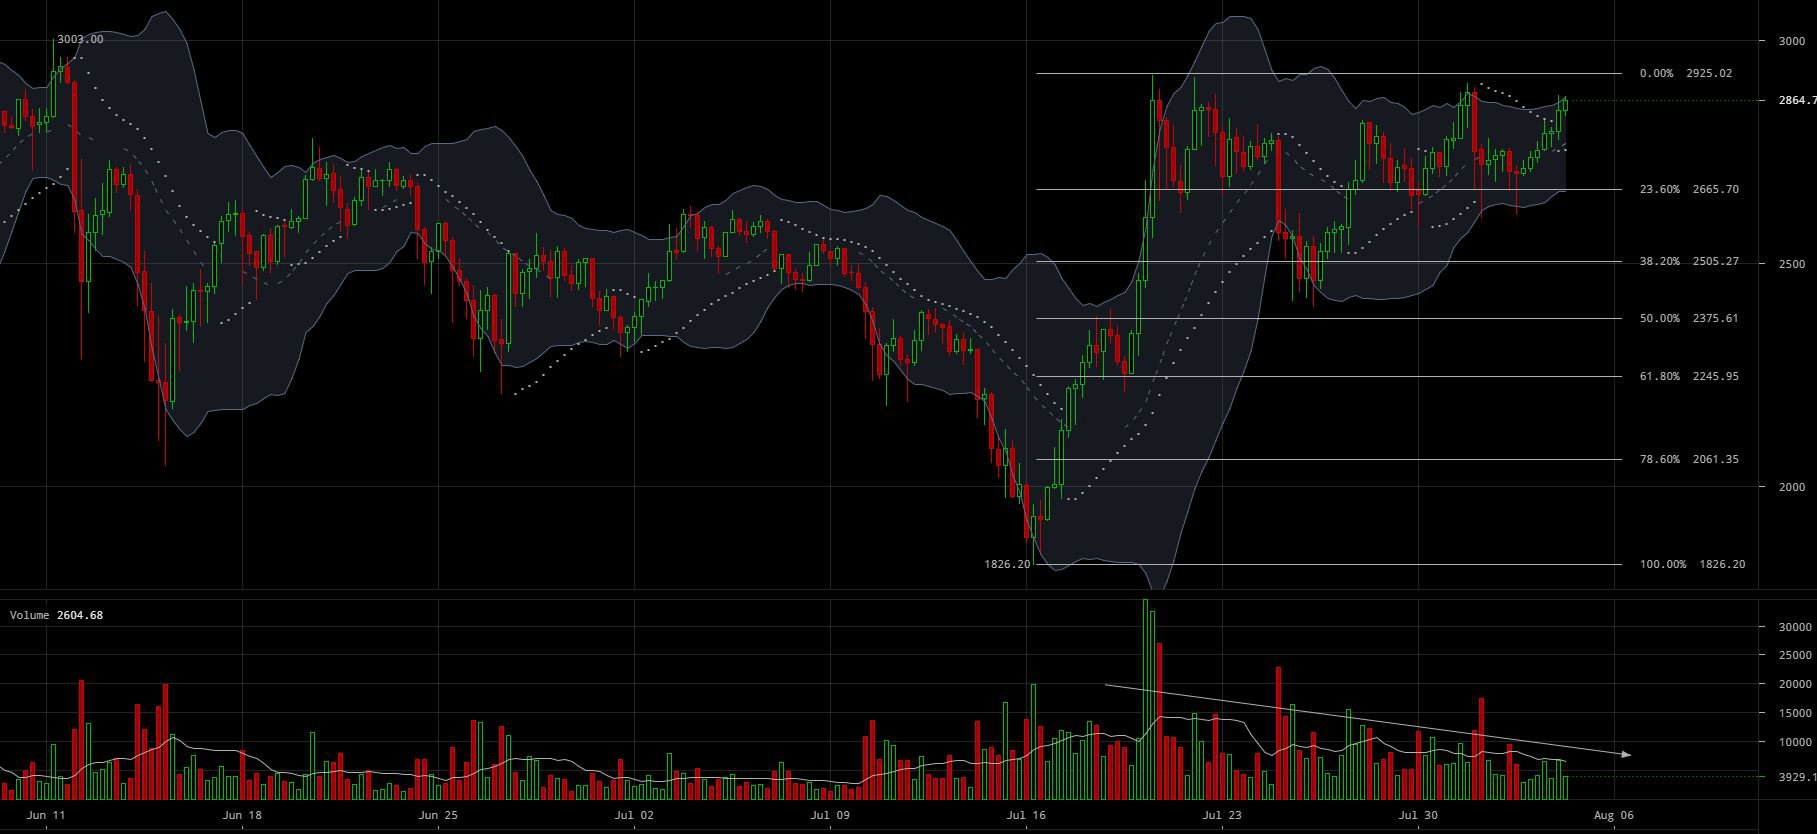 Figure 1: BTC-USD, 6-hr Candles, Bitfinex, Fibonacci Levels Post-bottom
The high $2,600 values (also the 23.6 percent Fibonacci Retracement line) have historic significance in this market because they are firmly established support values. However, if we look at the 6-hr volume trend, we can see that each rebound off the $2,600 values was paired with decreasing volume on every attempt to break support. The volume trend shown above is typically a sign that the market is no longer confident in the higher price values and will ultimately need stronger volume to break new highs.
Zooming in on the most recent test of $2,600, we can see another clean set of Fibonacci Retracement lines paving strong support and resistance values for the current trend:
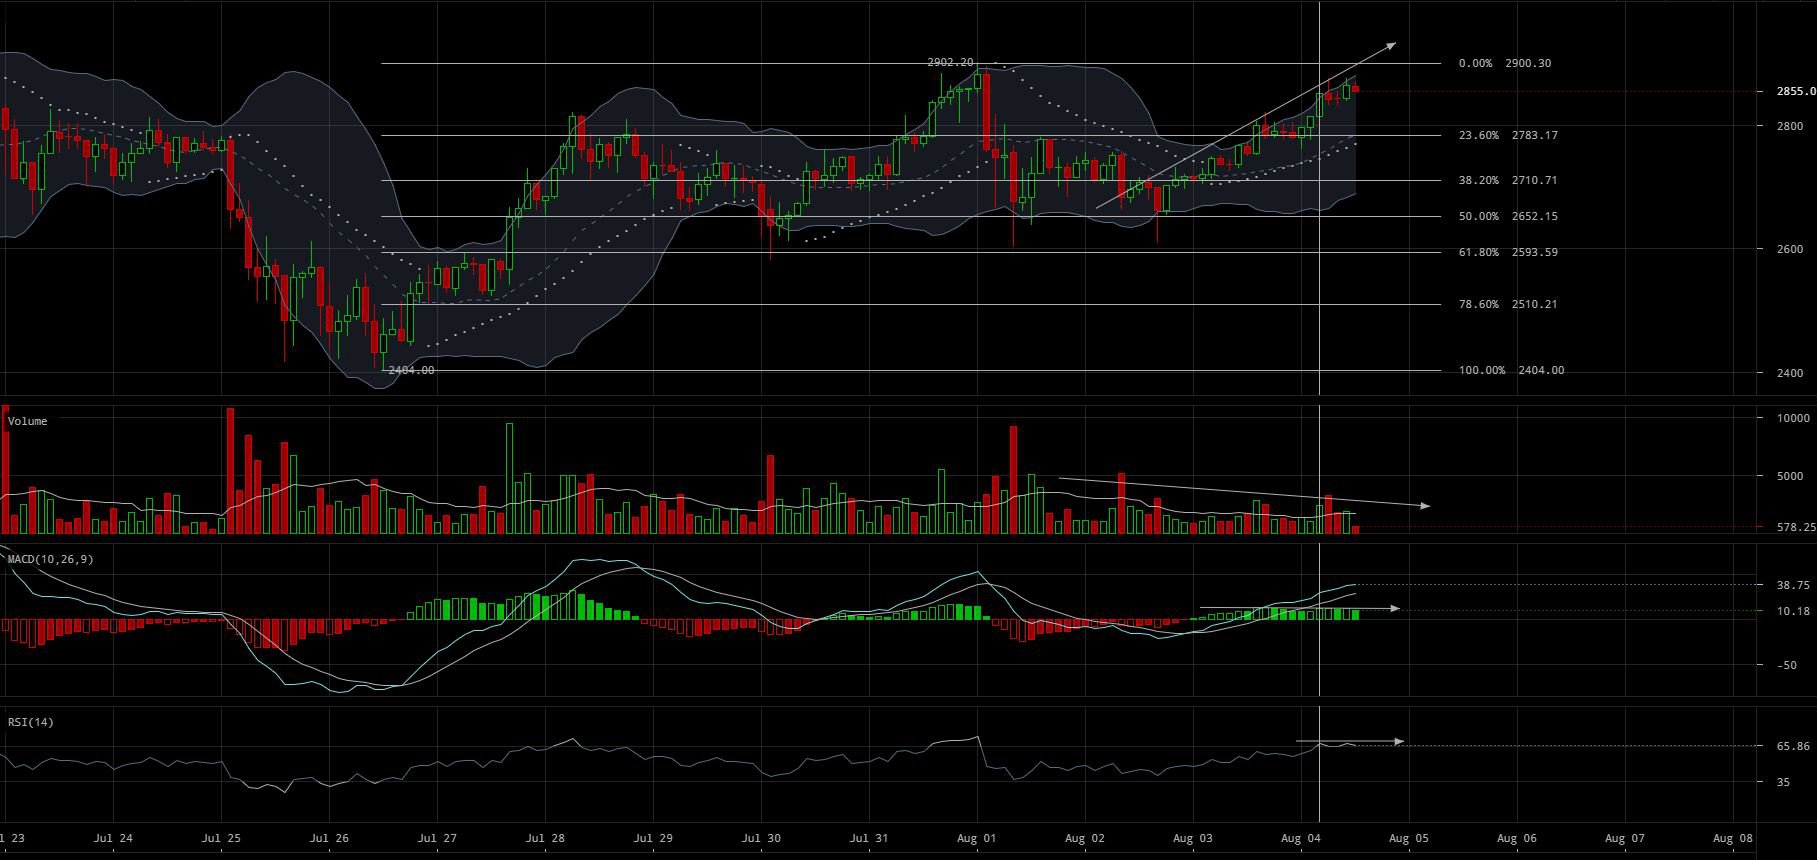 Figure 2: BTC-USD, 2-hr Candles, Bitfinex, Current Bull Trend
From this perspective, the strong support outlined in Figure 1 (the 23 percent Fibonacci Retracement values) is now shown in Figure 2 as the 50 percent Fibonacci Retracement values. However, this most recent bounce is showing strong signs of market momentum loss.
For those who are familiar with my style of technical analysis, I put a strong emphasis on volume trends and how they correlate with price movement. This trend is no exception: the most recent bounce is continuing to rise on decreasing volume. A trending market that moves on decreasing volume typically indicates that the trend is beginning to exhaust and will likely need to consolidate or pull back to garner support from lower values. Our current trend has several indicators of bullish exhaustion outlined not only in the volume trend, but also in the MACD and RSI (both tools are market momentum indicators).
The MACD and RSI are showing bearish divergence. Bearish divergence is a trend used by market analysts to objectively view price activity for indications of potential pullback or market consolidation. When the price is in an uptrend and the MACD histogram (the green/red bars) fails to make a new peak to correspond to the new price highs, the ears of bearish investors perk up, as this is typically when bears are looking to place their short positions. Much like the MACD histogram, the RSI can also be used to show market momentum loss — the market is said to be diverging bearishly if the price makes a new high but the RSI does not make a new high.
This recent, low volume climb in BTC-USD value is not terribly surprising. BTC began its ascent right around the time several major exchanges enabled Bitcoin Cash (BCH) deposits. Once the BCH deposits were enabled, those who were previously sidelined immediately post-fork were able to sell off their BCH and reinvest in other coins. (I won’t dive into BCH-USD analysis, but if you take a look at the price trend, it lines up with the BTC-USD price climb.)
Typically, it isn’t advisable to zoom in terribly close within the crypto-market because the volume doesn’t provide useful resolution to its perceived trend. However, in times of high volume I find it useful to look at the timescales as small as 5-minute candles to get a small peek at where the market is heading short-term:
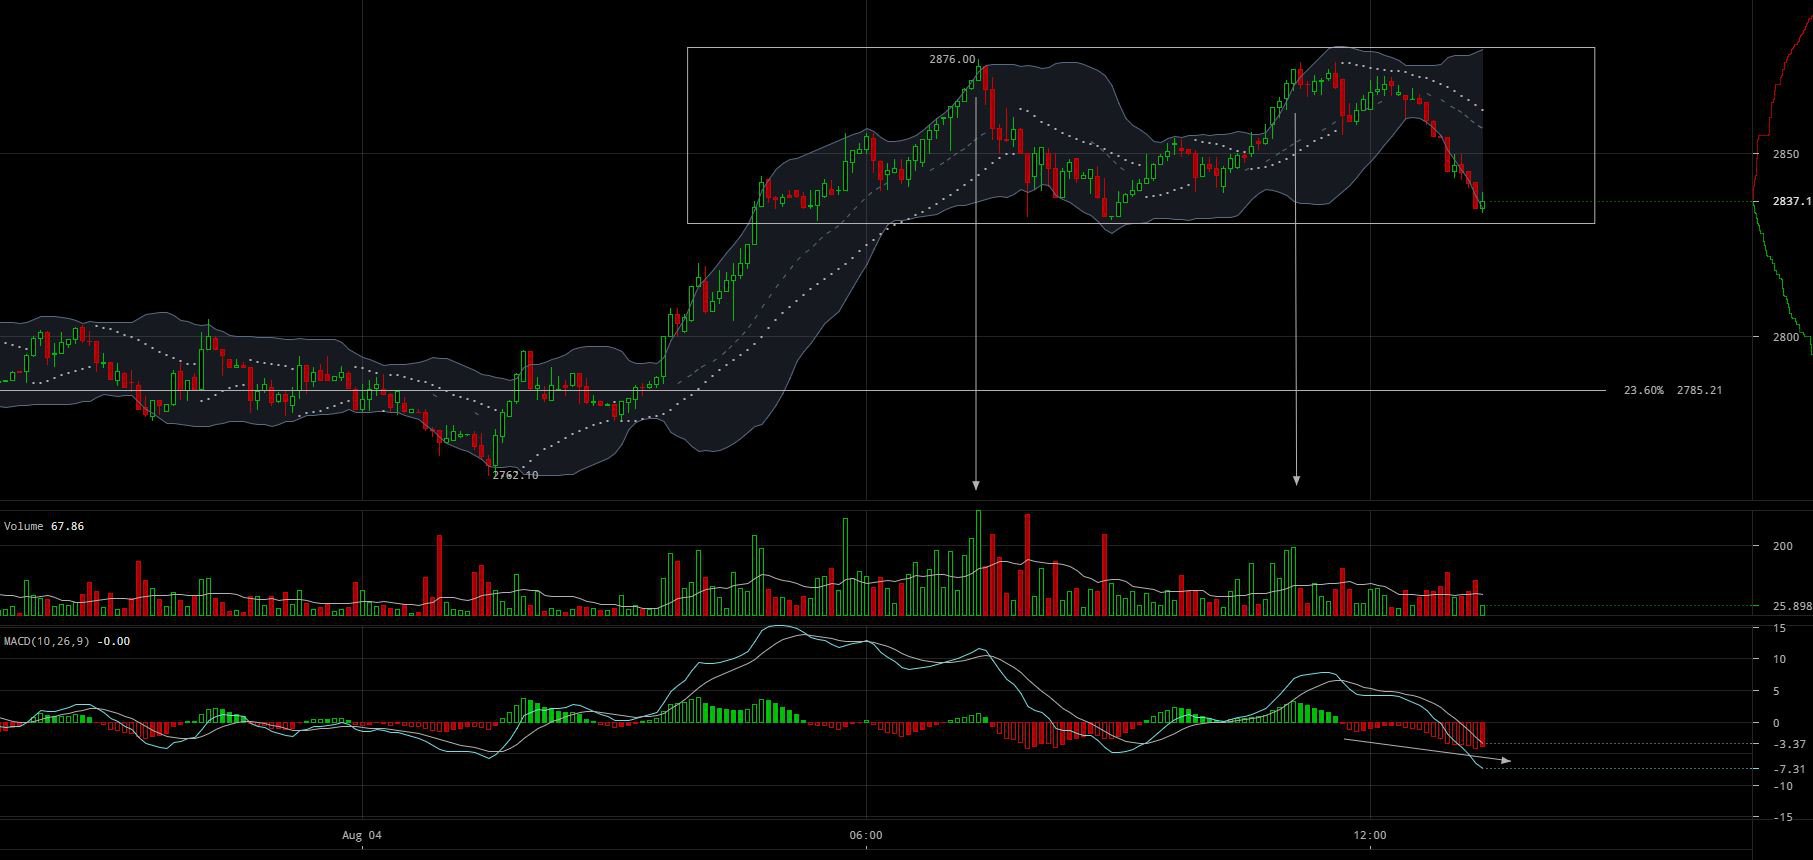 Figure 3: BTC-USD, 5-min Candles, Bitfinex, Double Top Reversal
Currently, the 5-minute candle trend is showing signs of a textbook Double Top Reversal (shown in the rectangle). The volume profile showing spikes on the two local highs indicates a pullback in price is possible.
Looking at the MACD histogram, we can see no signs of downward momentum loss as the histogram continues to make new lows to correspond to the lows made in price movement. To accompany the MACD, sustained sell volume is evident and hints toward continued interest in the lower price range. I won’t go into the details of how to calculate Double Top Reversal price targets, but if this reversal pattern holds true, we can expect price movement close to the 23 percent Fibonacci Retracement line shown above.
Summary:
-
On both the macro and micro trends, BTC-USD shows signs of diminishing upward momentum.
-
Exchanges recently enabled BCH deposits, and it is very likely that the recent hike in BTC-USD price was due to trades selling their BCH and purchasing BTC.
-
The immediate trend shows signs of bearish momentum and is in the process of testing a Double Top Reversal pattern.
Trading and investing in digital assets like bitcoin, bitcoin cash and ether is highly speculative and comes with many risks. This analysis is for informational purposes and should not be considered investment advice. Statements and financial information on Bitcoin Magazine and BTC Media related sites do not necessarily reflect the opinion of BTC Media and should not be construed as an endorsement or recommendation to buy, sell or hold. Past performance is not necessarily indicative of future results.
The post Bitcoin Price Analysis: BTC Markets Anemic After Initial BCH Trading appeared first on Bitcoin Magazine.