Bitcoin Price Analysis: Long and Short Squeezes Shape a Weakening All-Time High

This morning, BTC-USD pushed a new all-time high on several exchanges. However, this time, the momentum to continue higher seems to be waning. Shortly after establishing the new all-time high, there was a $150 flash crash that sprang a series of account liquidations across several exchanges in a move that would ultimately “long squeeze” the market. A long squeeze is a term used to describe the sudden cascade of long positions getting stopped out of their positions, causing market orders to propel the price even lower:
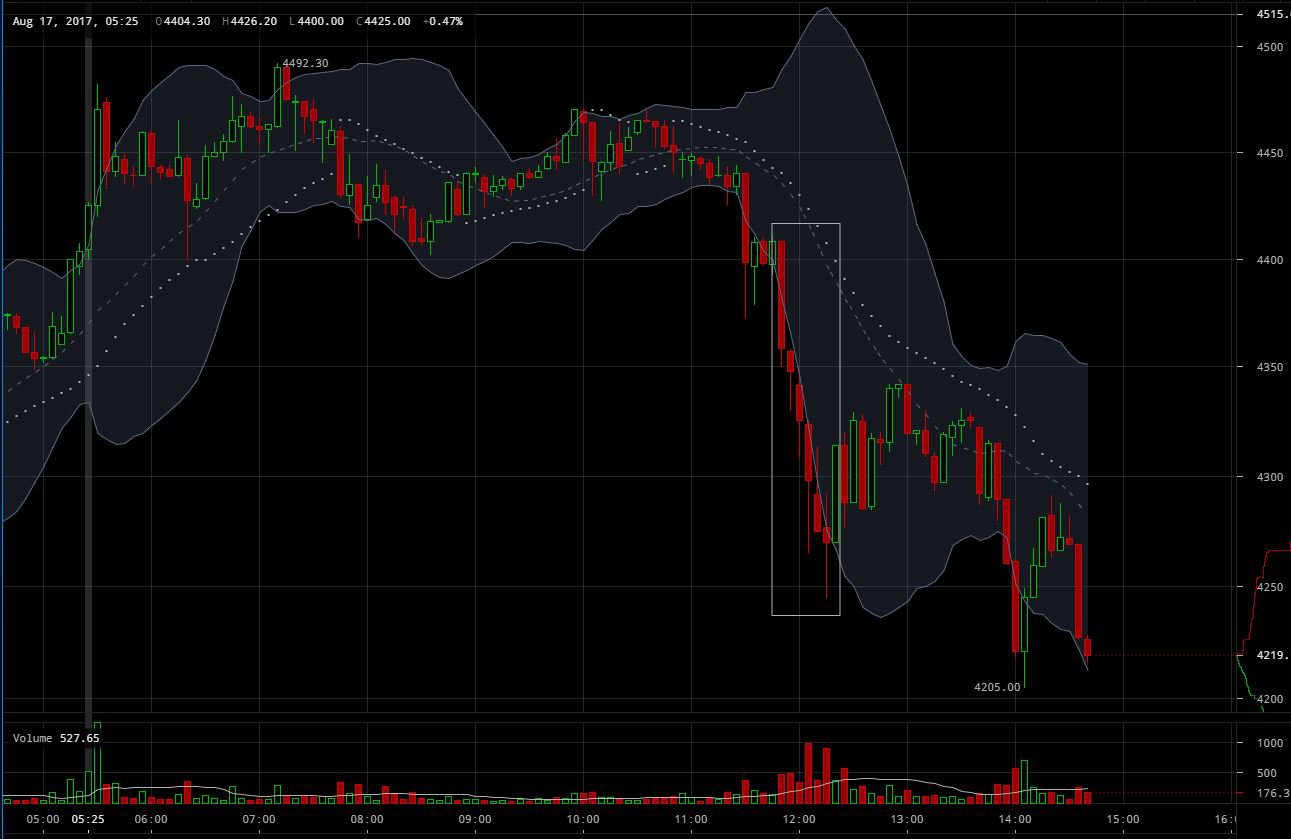 Figure 1: BTC-USD, 5-Minute Candles, Bitfinex, Long Squeeze
The figure above shows the price movement correlated to the volume during the $150 drop. Halfway through the drop we see a sudden spike in sell volume. This spike in volume is the beginning of the “long squeeze” that initiated the cascade of market sell orders caused by traders in long positions being forced out of their positions via their stop-loss market orders.
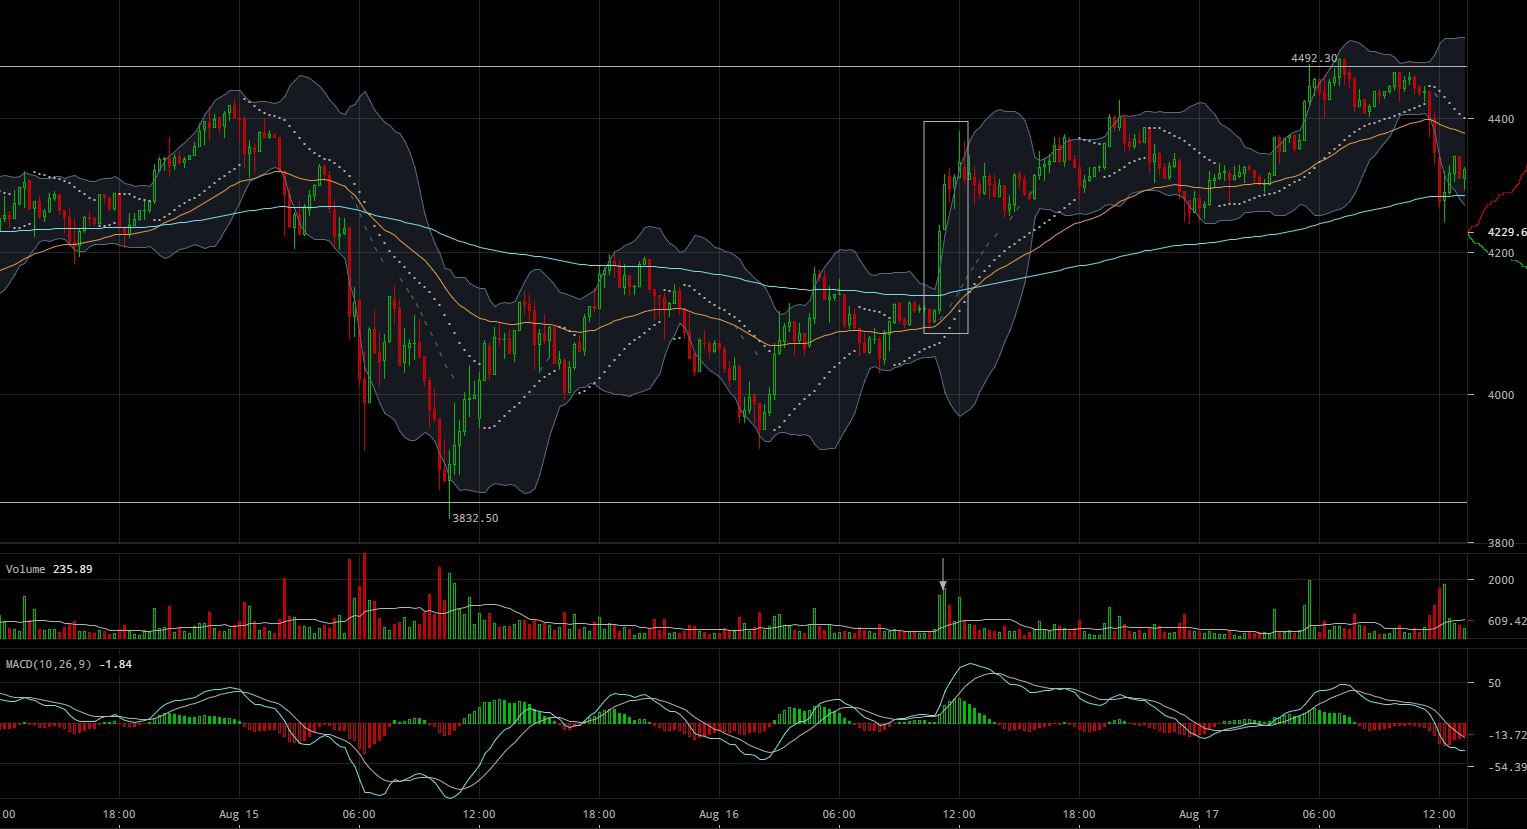 Figure 2: BTC-USD, 15-Minute Candles, Bitfinex, Short Squeeze
Yesterday, at around 12 pm EST, the exact opposite thing happened in a market event known as a “short squeeze.” You can think of a short squeeze as literally the opposite of a long squeeze: People who are anticipating a great short entry are suddenly forced out of their positions via their stop-loss orders, and market buy orders propel the market higher, thus triggering more stop-loss orders until the market equalizes.
Today the BTC-USD market has begun a series of long squeezes that pulled the price down by $300 in a matter of hours, and it doesn’t show much sign of letting up at the moment. Let’s take a look at the macro trend and see where the market is likely heading:
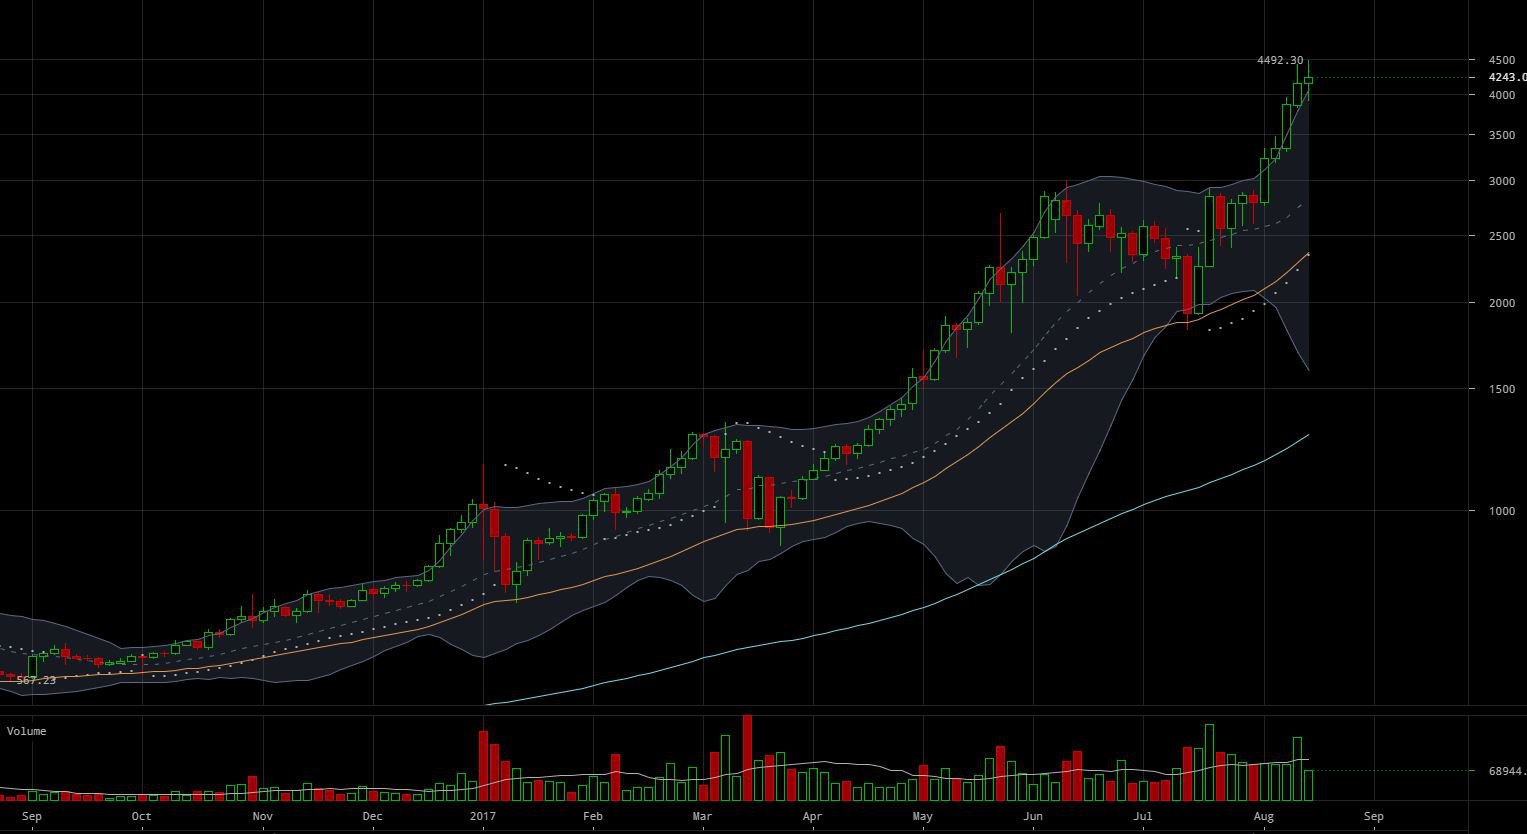 Figure 3: BTC-USD, 3-Day Candles, Bitfinex
For the fifth candle in a row, the 3-day candles have managed to puncture the Bollinger Bands in a move that indicates an overbought market. We have yet to see an attempt to move within the Bollinger Bands and provide some relief for the high price range.
Zooming in a little closer, we can see that clear signs of bullish exhaustion formed as we began to push the most recent set of all-time highs:
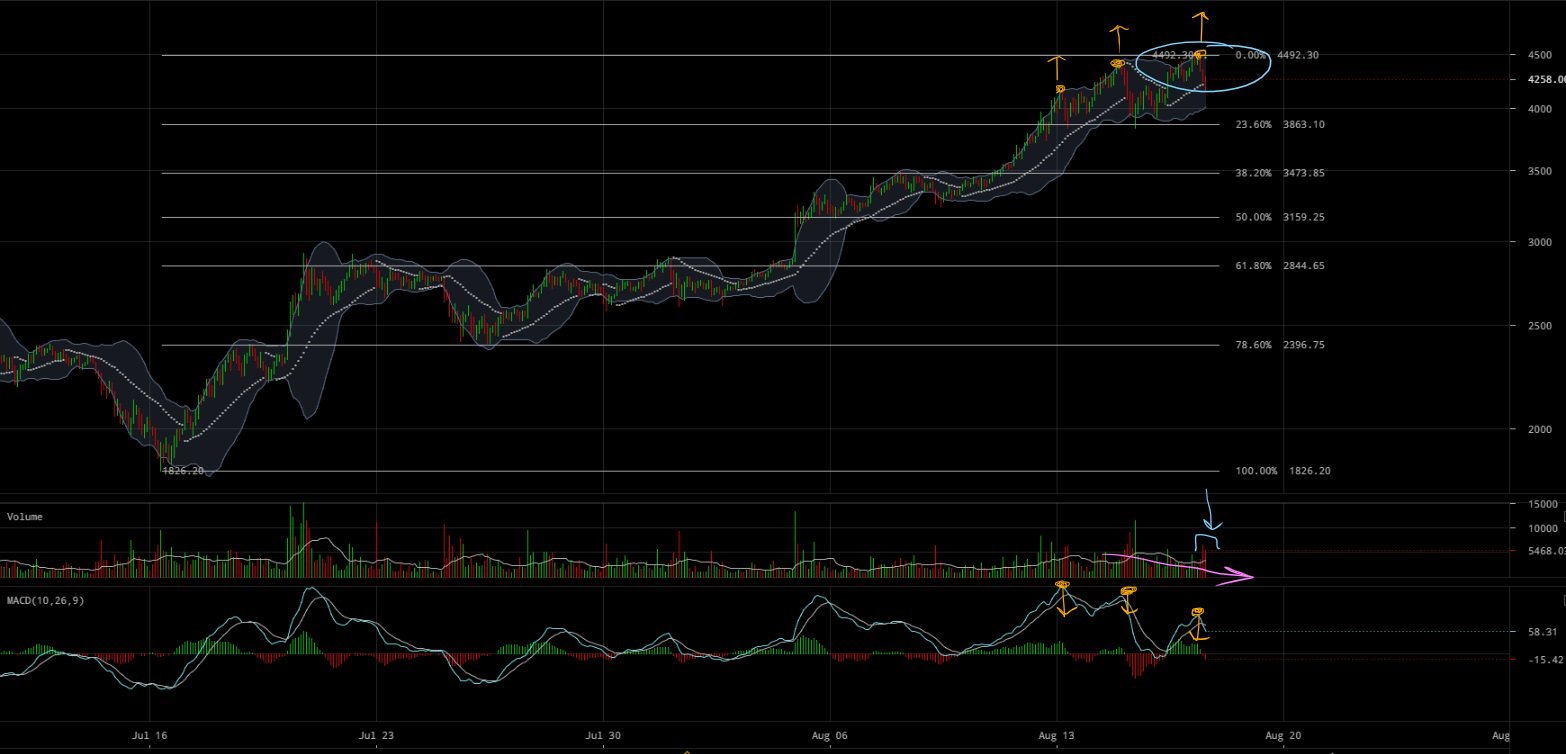
Figure 4: BTC-USD, 2-Hour Candles, Bitfinex, Bullish Exhaustion
The first thing that pops out about this trend is the decrease in volume (shown in pink) leading into this morning’s all-time high. Upon reaching that high, sell volume began to pick up considerably (labeled in blue) and has continued to remain strong during the push into the $4300 and $4200 prices. The previous all-time highs (labeled in yellow) are currently paired with a decreasing MACD moving average/signal line trend that indicates the market is losing bullish momentum across the macro trend.
The BTC-USD market seems to be running on fumes at the moment, but I would not be surprised at all to see an all-time high squeezed out of this market. However, I would be VERY surprised if that all time had any notable follow-through. The market volume on the macro levels has steadily declined, and there are key market indicators that hint toward the need for sustained sideways consolidation. Alternatively, a strong market pullback might be in the cards for BTC-USD. Each push toward the new highs has been greeted by strong sell volume. In the event of a market retracement, your key support levels on the macro exist along the Fibonacci Retracements shown below:
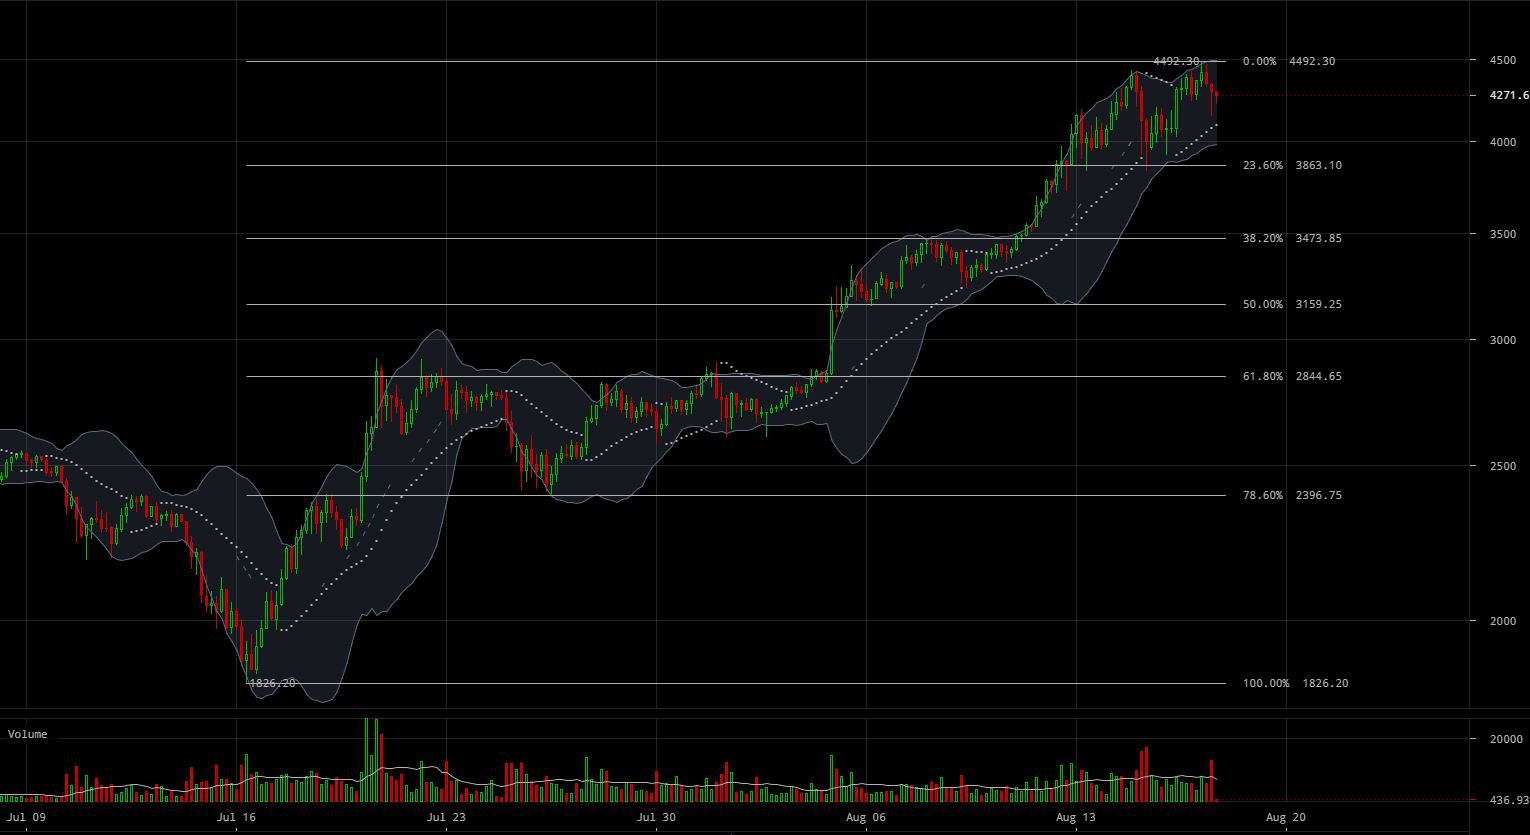 Figure 5: BTC-USD, 4-Hour Candles, Bitfinex, Key Support Levels
When the market begins to struggle to push new all-time highs, it is important to keep a close eye on the volume and see how it interacts with the price movement. Consistent price growth on decreasing buy volume is a signal that the bears, although losing the battle in price currently, are gathering as the market nears its final top before ultimately correcting or consolidating. And given the price growth over the past 30 days, I would be inclined to lean toward the former rather than the latter.
Summary:
-
Short squeezes and long squeezes have begun to shape the current market trend.
-
On the macro and micro scale, the market is showing a highly overbought market and is beginning to lose upward steam.
-
Key support levels lie on the Fibonacci Retracements shown in Figure 5.
Trading and investing in digital assets like bitcoin, bitcoin cash and ether is highly speculative and comes with many risks. This analysis is for informational purposes and should not be considered investment advice. Statements and financial information on Bitcoin Magazine and BTC Media related sites do not necessarily reflect the opinion of BTC Media and should not be construed as an endorsement or recommendation to buy, sell or hold. Past performance is not necessarily indicative of future results.
The post Bitcoin Price Analysis: Long and Short Squeezes Shape a Weakening All-Time High appeared first on Bitcoin Magazine.