
Bitcoin Price Analysis: Possible Bear Pennant Suggests End to Market Consolidation

Looking back at bitcoin’s parabolic curve, we can see notable lines of support and resistance throughout its market cycle. Two highly reliable sources of support and resistance are the set of 50/200 EMAs and the Fibonacci Retracement set from the beginning of the bull market to the top of our current all-time high:
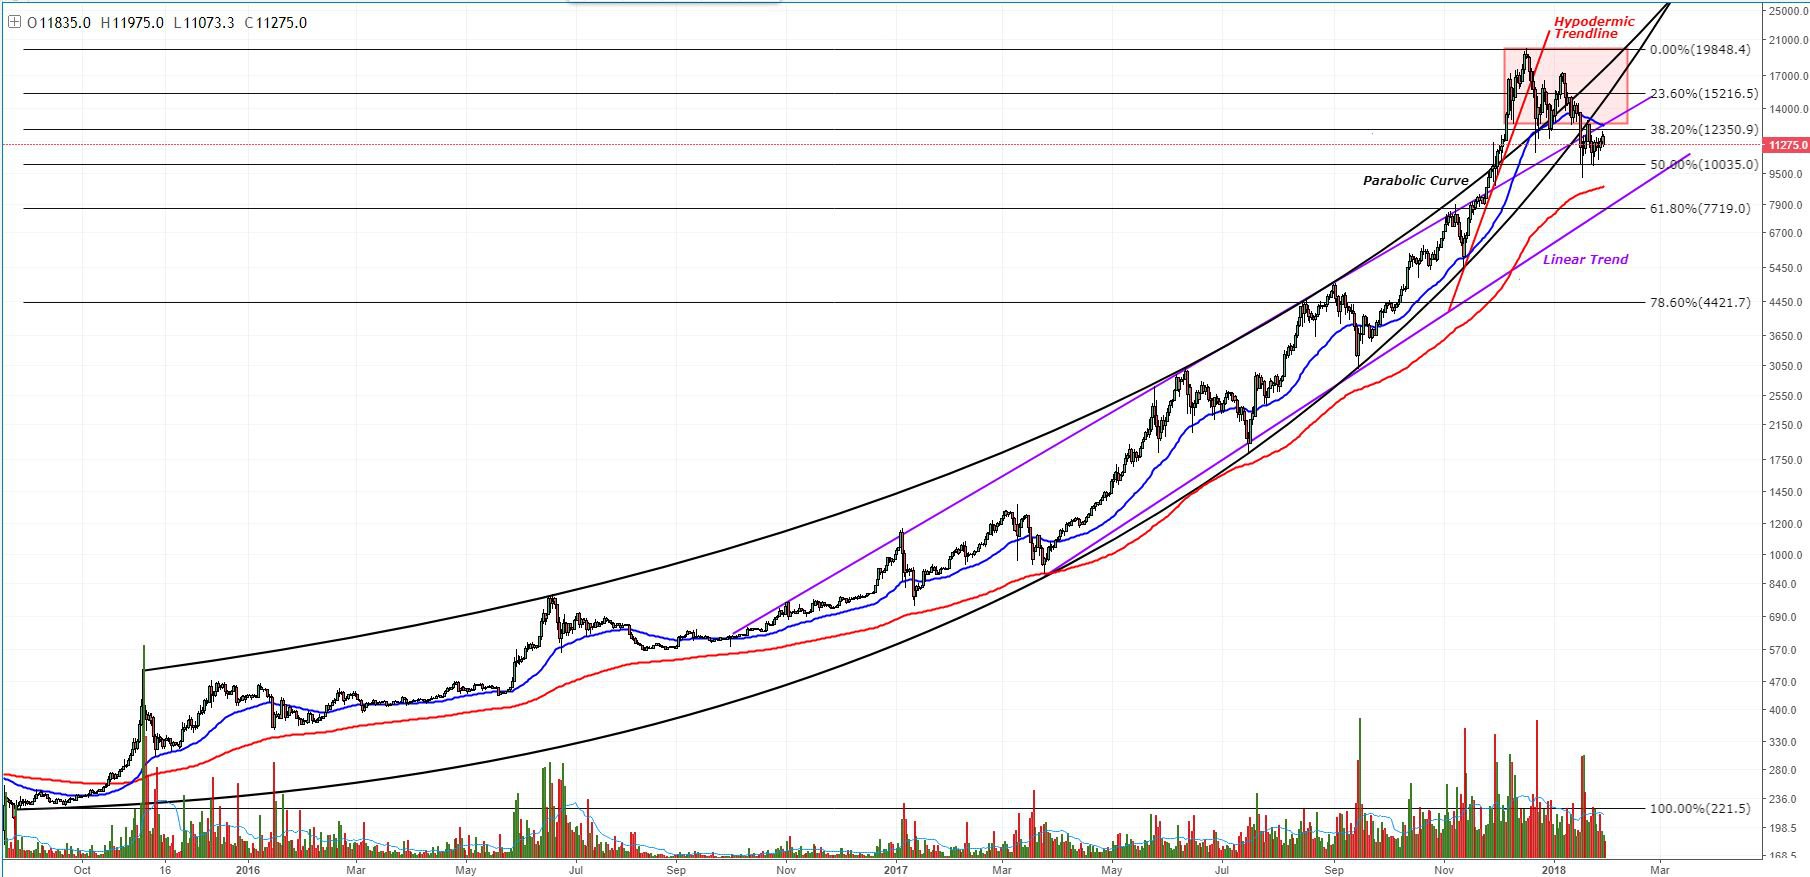 Figure 1: BTC-USD, 1-Day Candles, Macro Trend
Over the last couple days, bitcoin has attempted to break the overhead resistance surrounding the 38% retracement values and the 50 EMA on the daily candles. Unfortunately, it hasn’t gathered enough bullish momentum to carry us through the resistance level.
If we begin to look at lower time frames, we can see the signs of bearish consolidation that could potentially lead to a significant markdown in price:
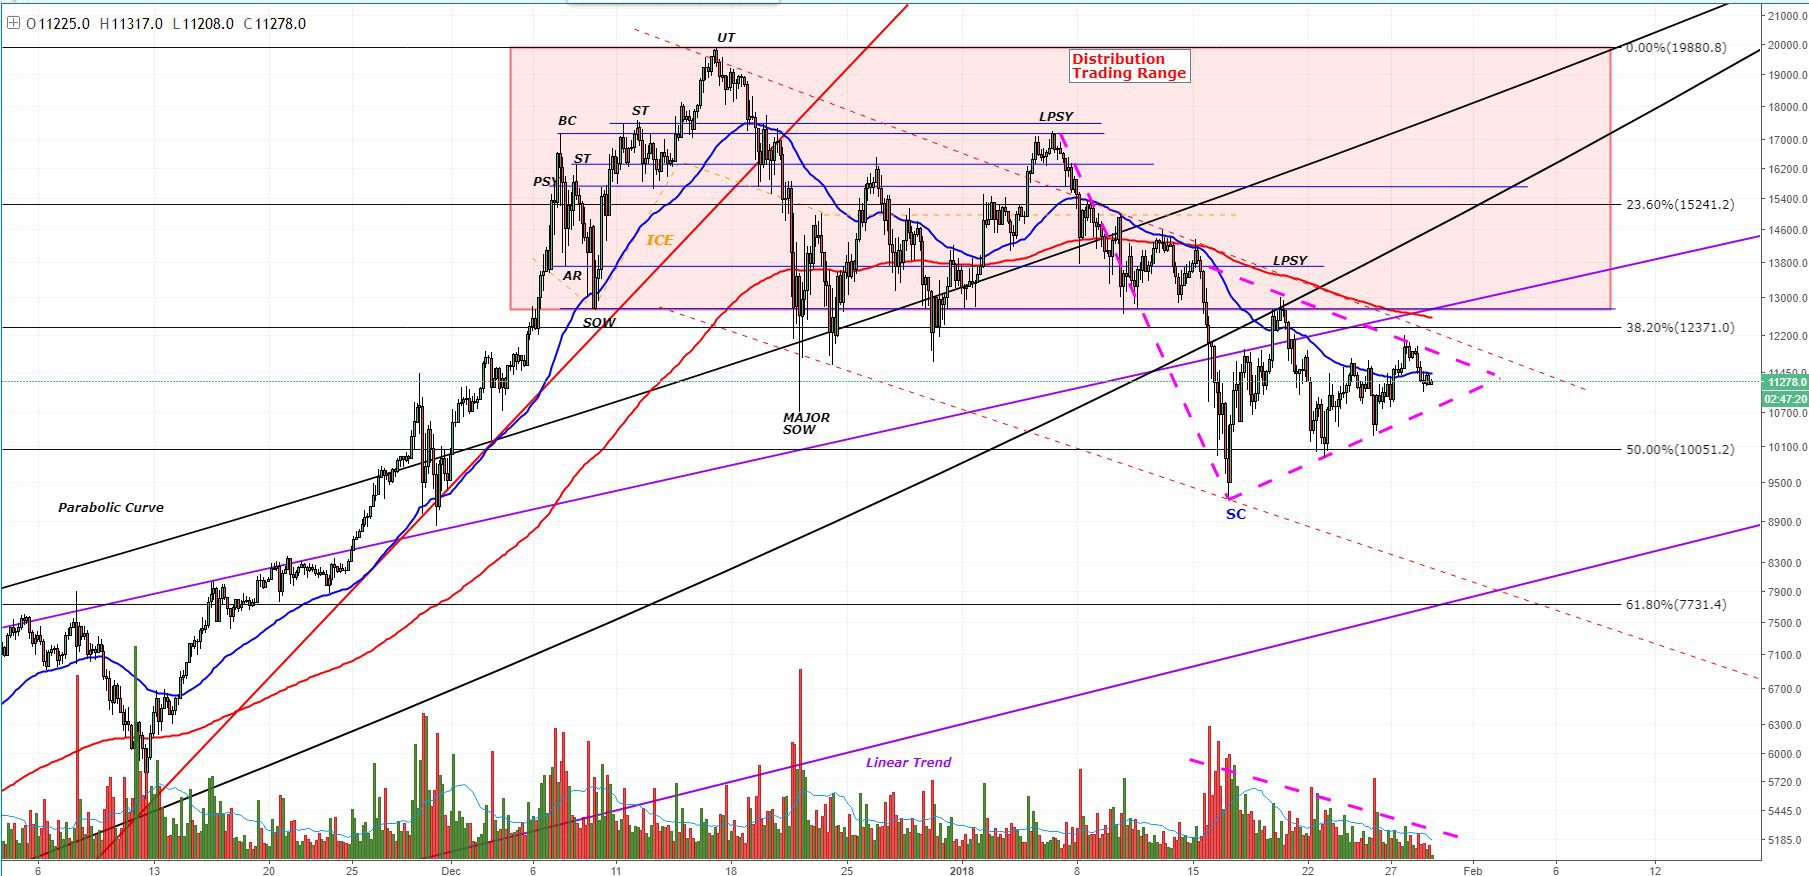 Figure 2: BTC-USD, 4-Hour Candles, Macro Bear Pennant
The bear pennant (outlined by the pink dashed line) marks a strong, bearish continuation pattern that could have us testing values as low as the $4,000s. The textbook signs of the bear pennant include a bearish move leading into a symmetrical triangle. Confidence of this continuation pattern increases when we see volume consolidation throughout the length of the symmetrical triangle. Together, all these signs make the bear pennant continuation pattern very likely.
In the event of the bearish continuation, we can expect to find support in the follow zone that may slow the dramatic price target considerably until it meets its ultimate price target: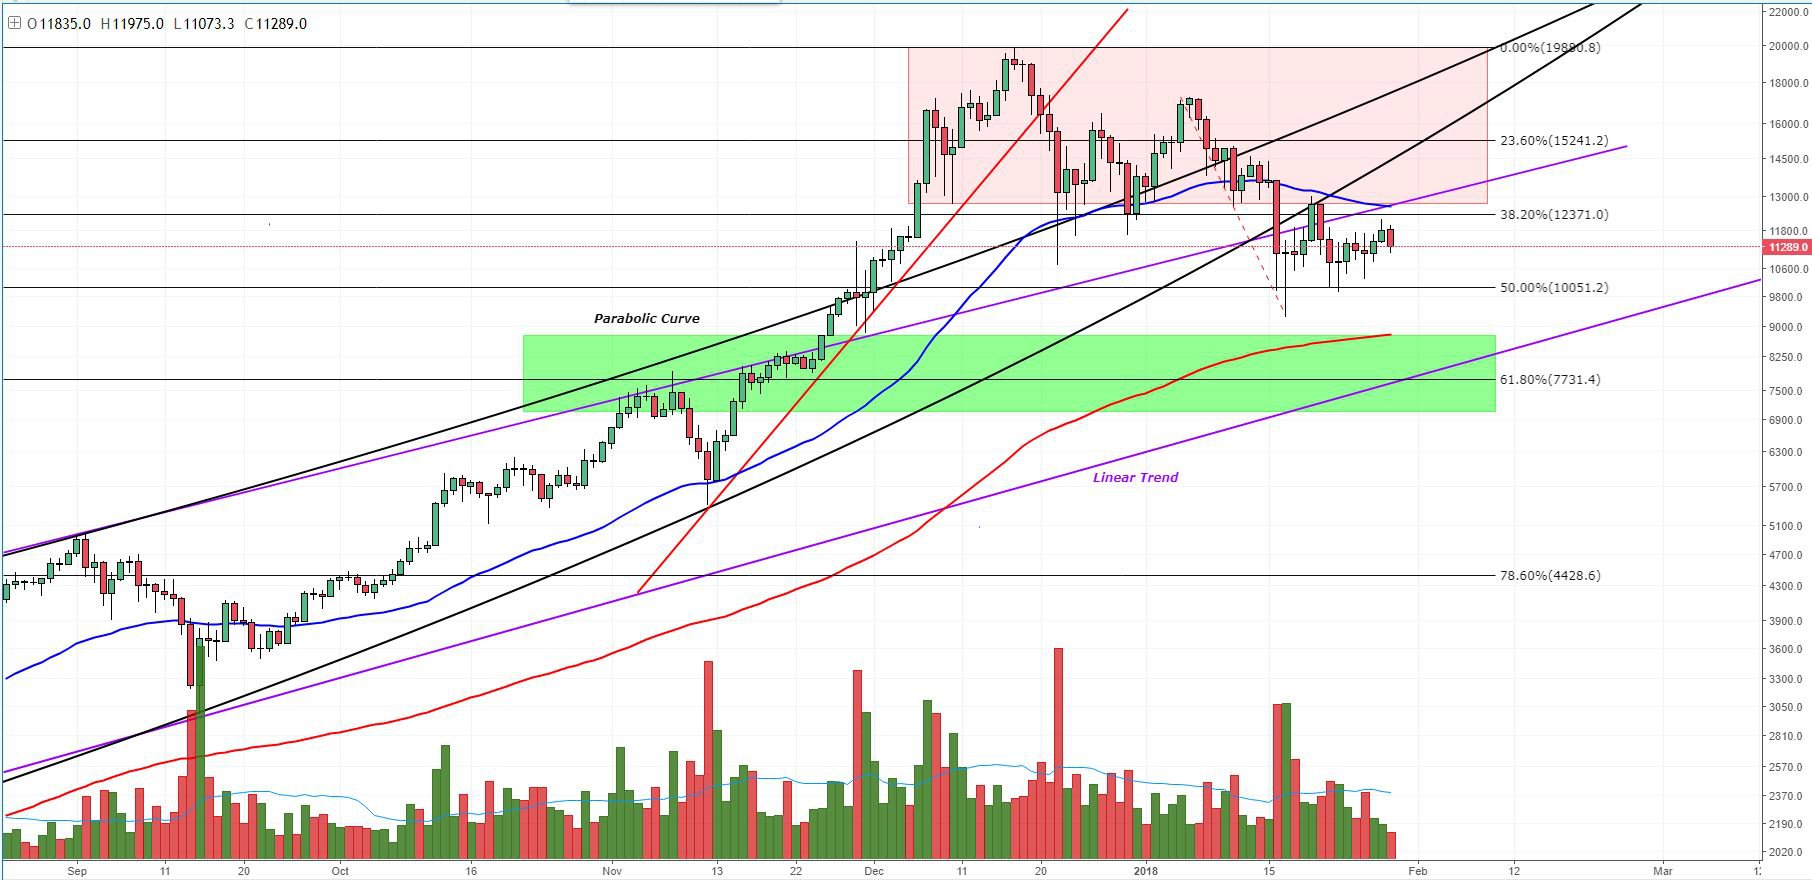 Figure 3: BTC-USD, 1-Day Candles, Support Below Bearish Pennant
The 61% Fibonacci retracement values and the daily 200 EMA are very strong support areas that will not be punctured without some significant volume and selling pressure. This area of support also coincides with the macro linear trendline outlined in Figure 1 above. This confluence of support leads me to believe that the 61% Fibonacci levels will be a logical level of consolidation where the market will decide if it has bottomed out or will ultimately continue further down.
Summary:
- Bitcoin appears to be at the end of its multiweek consolidation period.
- The market is consolidating in a bearish consolidation pattern called a bear pennant.
- If the market reaches its full measured move for the bear pennant, we could see prices as low as $4,000 region.
- If we break to new lows, we will logically find support around the 61% Fibonacci retracement values.
Trading and investing in digital assets like bitcoin and ether is highly speculative and comes with many risks. This analysis is for informational purposes and should not be considered investment advice. Statements and financial information on Bitcoin Magazine and BTC Media related sites do not necessarily reflect the opinion of BTC Media and should not be construed as an endorsement or recommendation to buy, sell or hold. Past performance is not necessarily indicative of future results.
This article originally appeared on Bitcoin Magazine.