Bitcoin Price Analysis: Sign of Strength Shows Continued Buyer Interest

At the time of this article, the news from the Winklevoss ETF being denied by the SEC is still fresh and it is unclear what impact it may have on the overall macro trend of the market. Prior to the ETF ruling, the bulls continued to show demand as the bitcoin market saw a strengthening rally supported by expanding volume:
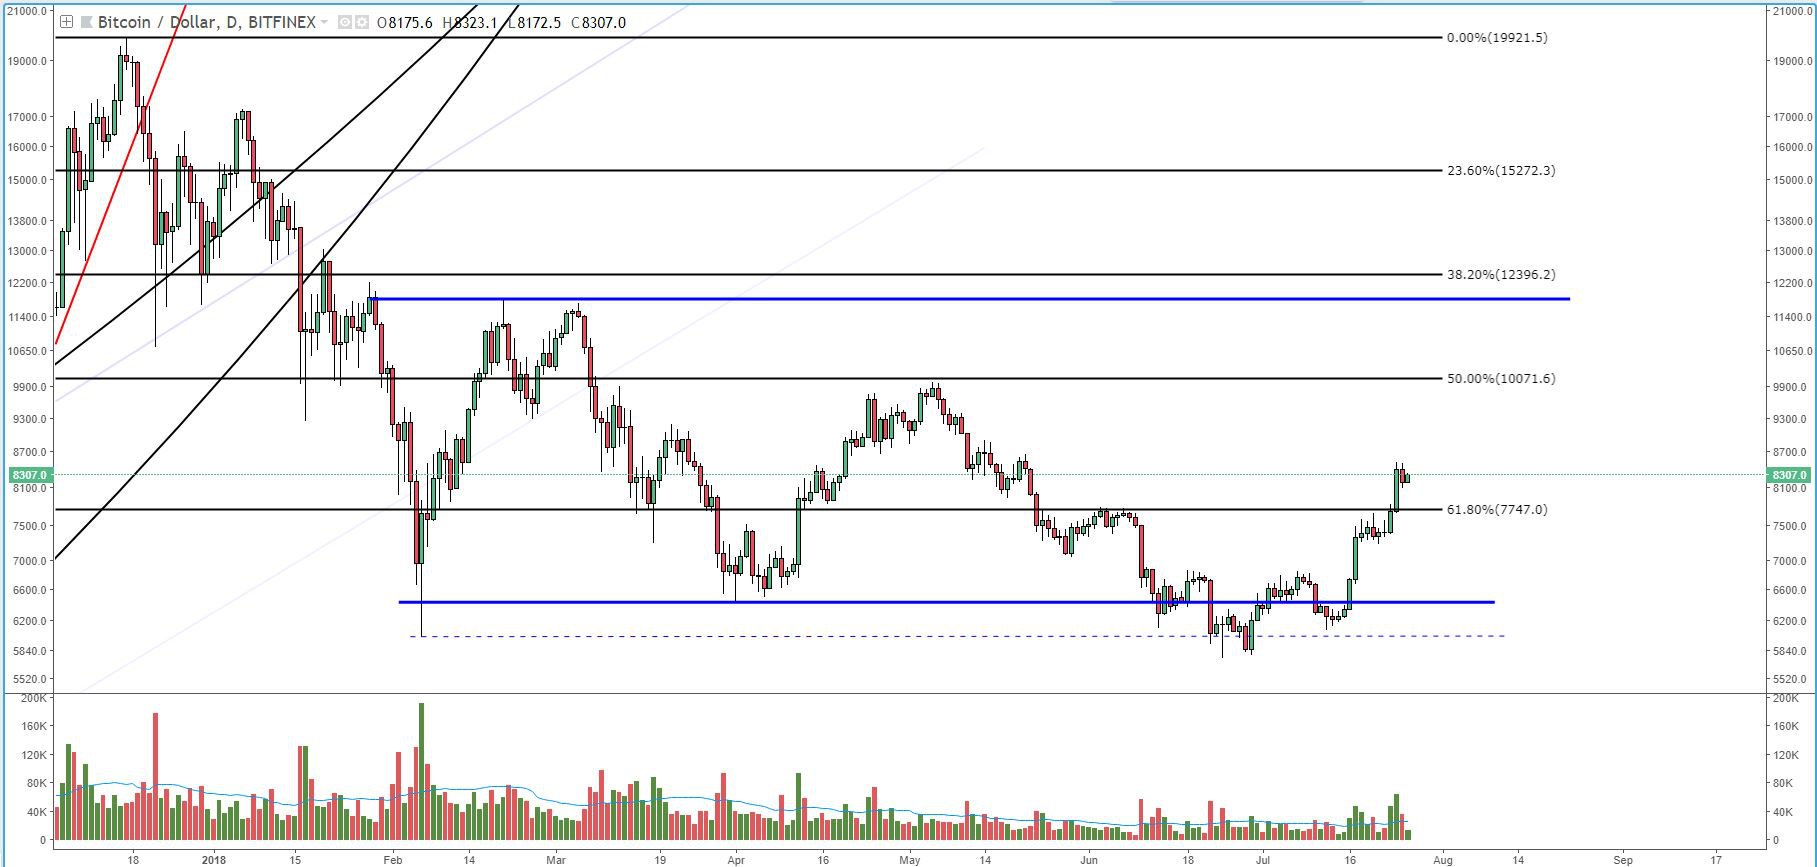 Figure 1: BTC-USD, Daily Candles, Macro Trading Range
Shortly after the retest of the trading range (TR) spring discussed in our previous bitcoin market analysis, the price strongly reacted by breaking through notable resistance on expanding spread and volume. Surging out of a spring on expanding volume and spread is a textbook characteristic of a “Jump Across the Creek” (JAC). I won’t bore you with the minutia of TR anatomy, but you can basically think of the JAC (sometimes called a Sign of Strength) as a test of demand after the market has proven to show signs of seller exhaustion. Essentially, the creek can be thought of as a wavy area of resistance that constantly grinds down bulls and wears down their will to continue to buy:
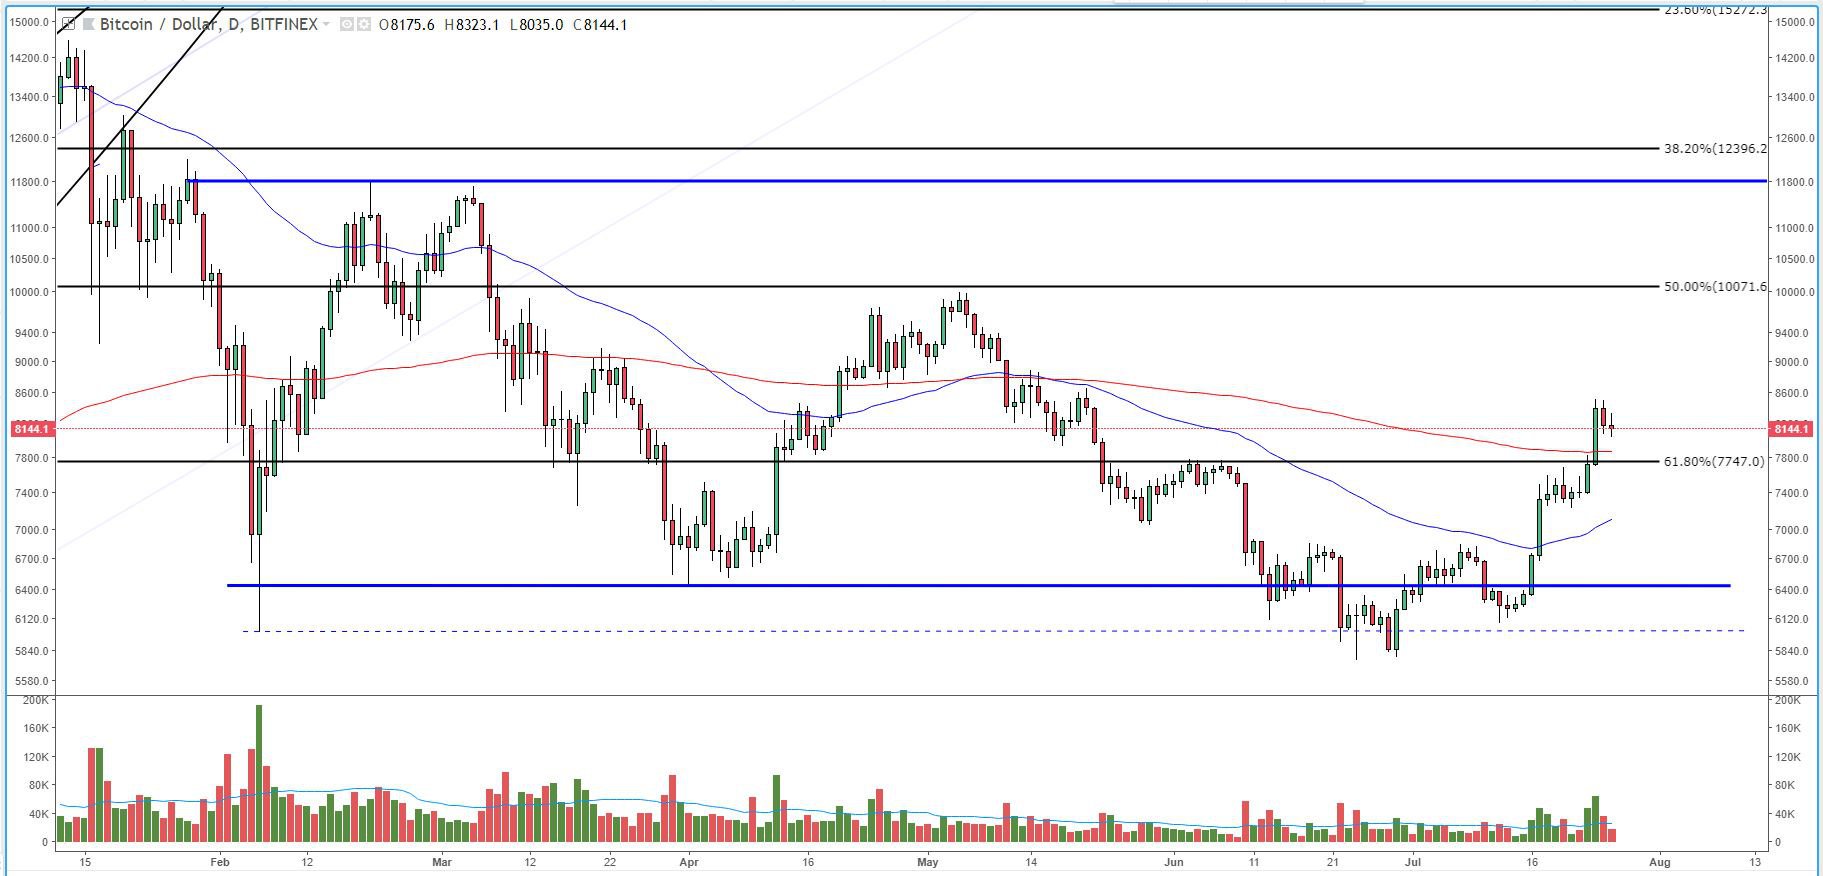 Figure 2: BTC-USD, Daily Candles, Upper and Lower Creek
The main creek (circled in pink) is a great representation of the general, overhanging area of resistance. In our case, the resistance is perfectly represented by the daily 50 EMA. The JAC occurs when the market supply has dwindled and the order books are clear for a strong surge of buying pressure to suddenly clear resistance levels.
Although the creek and JAC are metaphors, we can think of the spring as a running start and the JAC as the physical act of jumping over a creek (the 50 EMA). Often, markets have both upper and lower creeks — sometimes multiple upper creeks present themselves.
Currently, bitcoin has revealed two creeks it has managed to clear on strong spread and volume. The upper creek (shown above in red) is the daily 200 EMA. So far, we have managed to clear two major resistance levels without so much of a peep from the bears.
One common trait in JACs is a pullback to recently broken resistance (now turned support) to test not only the overhanging supply, but the demand on the buyback of the support test. In our case, our creek support would be on the 200 EMA.
At the time of this article, the Winklevoss ETF was announced as being denied by the SEC. While I don’t personally believe the ETF proposal was a factor priced into this recent bullish rally, it will undoubtedly create tests of the lower price range. If the market manages to break current support levels, a test of the 200 EMA is undoubtedly next on the agenda.
The 200 EMA tends to be the gold standard in terms of market health. Our current breach of the 200 EMA should not be downplayed as it is a sign of strength to larger players that are looking for opportunities to enter the market. If the market manages to retrace to the 200 EMA and if support holds, I fully expect to see a large expansion of volume pushing the price to new highs as this will be a major buy signal for many large, risk-averse, sidelined buyers.
Summary:
- Bitcoin has continued to see a sign of strength in the form of expanding volume and increased price spread. This market dynamic is a definite change of character from the months preceding this move and should not be underestimated.
- We managed to clear both the daily 50 and 200 EMA and show no signs of weakening demand. If we manage to see a retracement, expect to find support on the 200 EMA where the market will up for further evaluation.
- If the market holds the 200 EMA level, it is likely that expanding volume will react on any rally coming off the 200 EMA support.
Trading and investing in digital assets like bitcoin and ether is highly speculative and comes with many risks. This analysis is for informational purposes and should not be considered investment advice. Statements and financial information on Bitcoin Magazine and BTC Media related sites do not necessarily reflect the opinion of BTC Media and should not be construed as an endorsement or recommendation to buy, sell or hold. Past performance is not necessarily indicative of future results.
This article originally appeared on Bitcoin Magazine.