
Bitcoin Price Analysis: Strong Rally Tests Overhanging Resistance

Earlier this week, bitcoin enjoyed a strong and quick rally, spanning all the way from the low $3,100s to the upper $3,900s — in other words, a move that previously took the market weeks to make, this time took place in just a few short days. And now, at the time of this article, it’s currently seeing a rejection shortly after running through several layers of overhanging resistance.
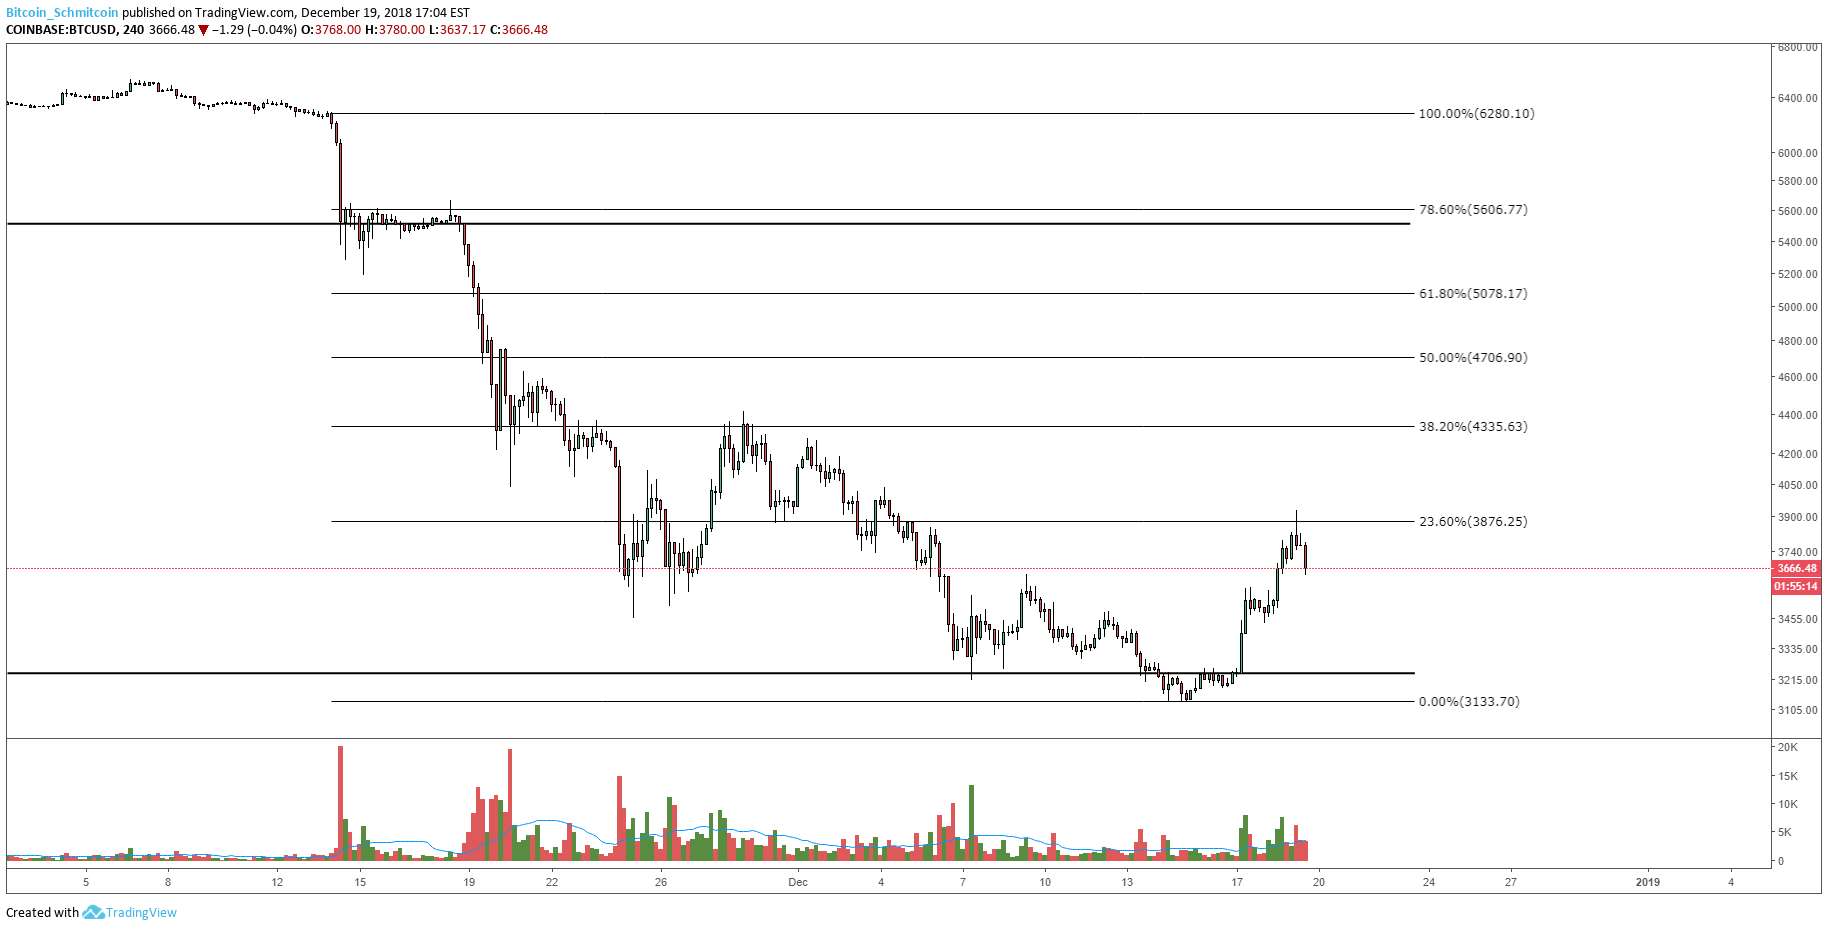 Figure 1: BTC-USD, 4-Hour Candles, Fibonacci Retracements
Although the market rallied 25% in just a few days, if we zoom out to higher time frames, we don’t exactly see strong signs of bullish presence in the market: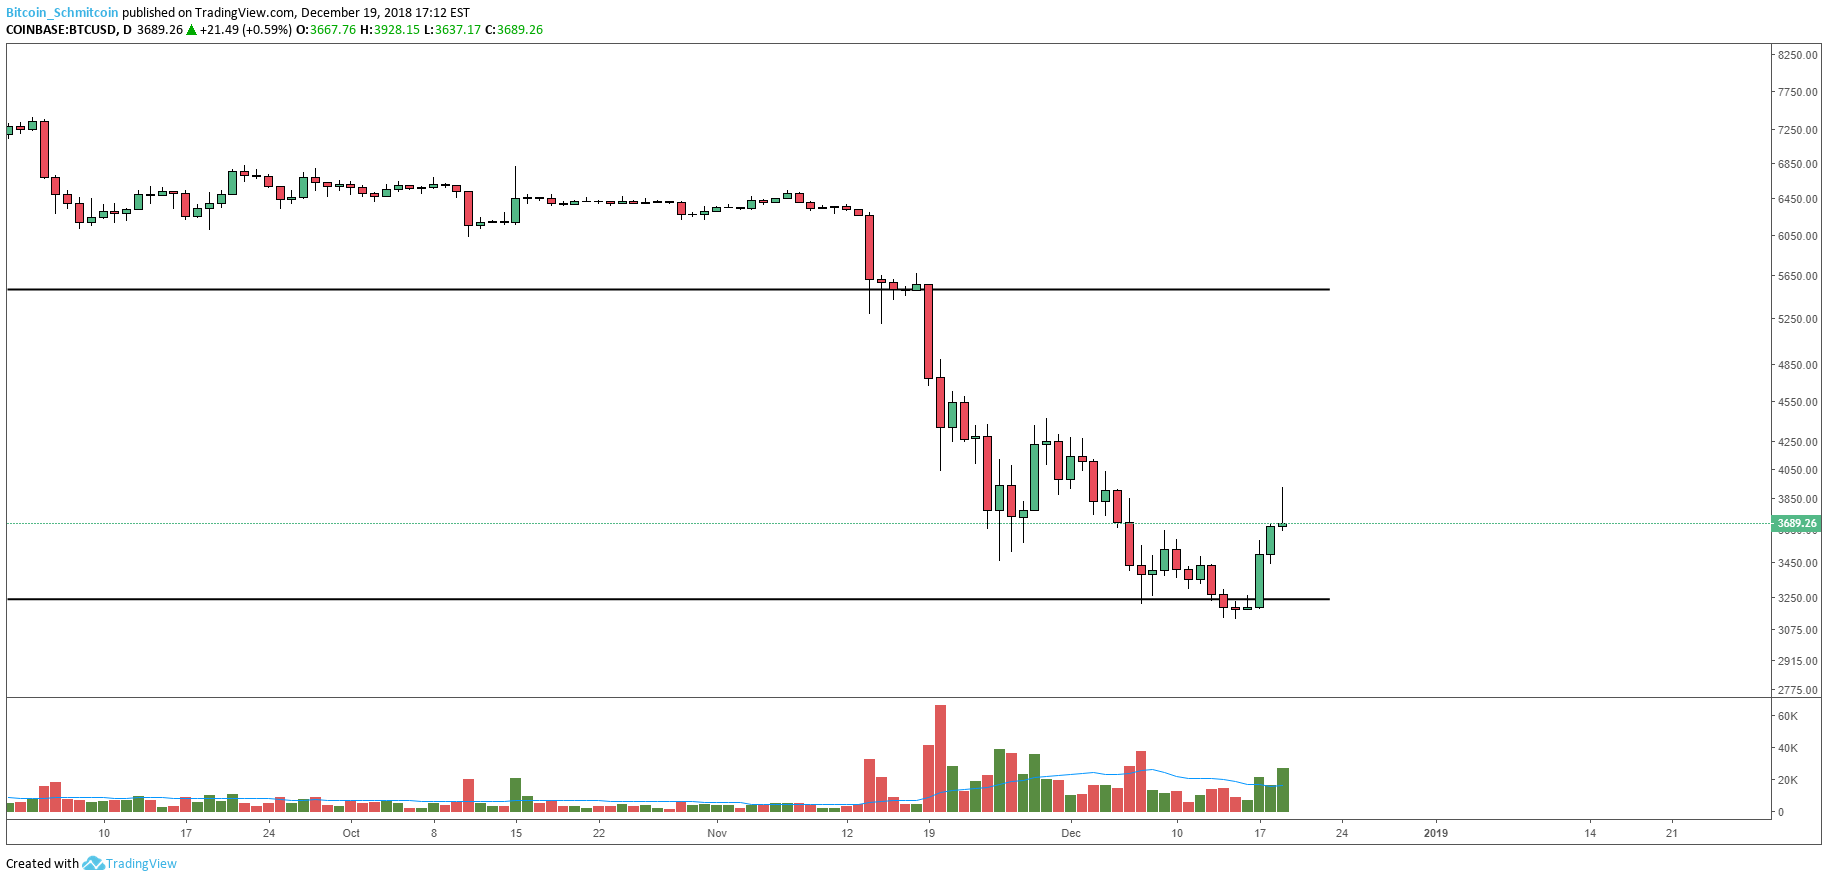 Figure 2: BTC-USD, Daily Candles, Gravestone Doji
Right now, seated atop the current rally lies a “Gravestone Doji.” A Gravestone Doji is a reversal setup that represents a lot of intraday volatility that yields very little progress on the daily candles. You can see the very narrow body representing little progress between the open and close of the trading session, and a long wick that represents the intraday volatility. It should be noted that this is just a setup — it isn’t even a valid setup until the market closes the daily candle. Which, again, is still open.
Looking back at the intraday chart, we can see we managed to break upward from a bullish reversal pattern called a “Falling Wedge”: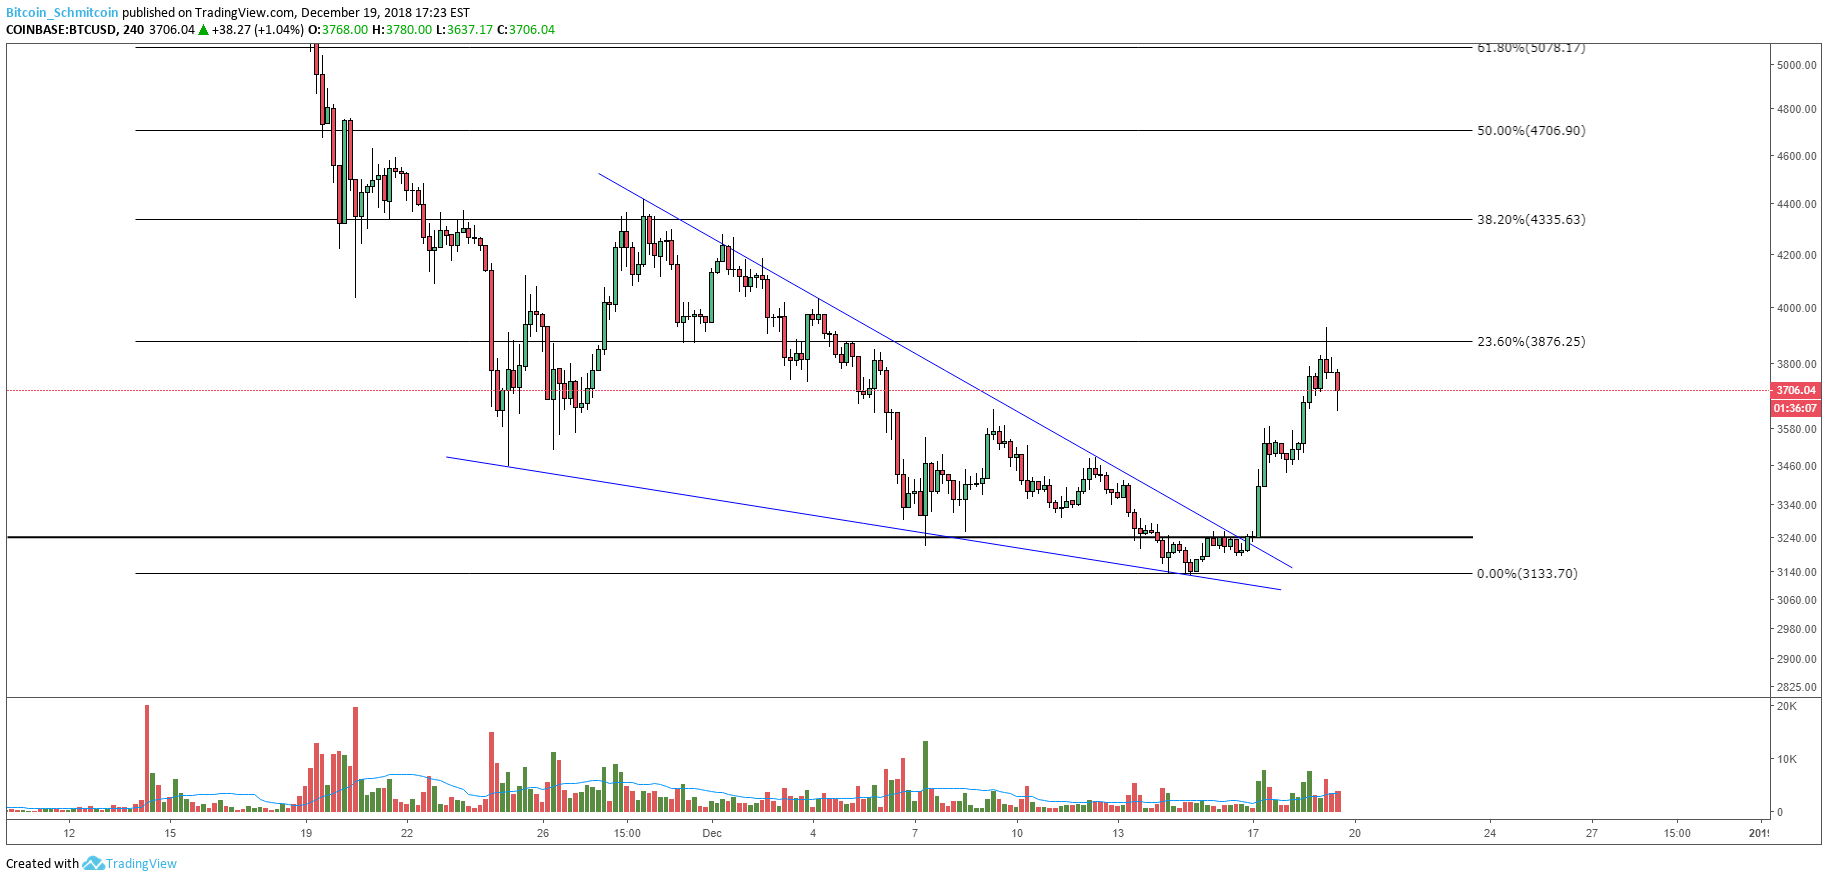 Figure 3: BTC-USD, 4-Hour Candle, Falling Wedge
Unfortunately, however, we hit the typical price target for the Falling Wedge. This doesn’t necessarily mean we are going to have a swift reversal, but many traders that played this reversal will be taking profit on their long positions while eager bears jump on the opportunity for a potential ride back down.
One final item to consider here is the volume trend. We have yet to really see capitulatory finality with the volume trend — which is typical of strong, unrelenting moves downward: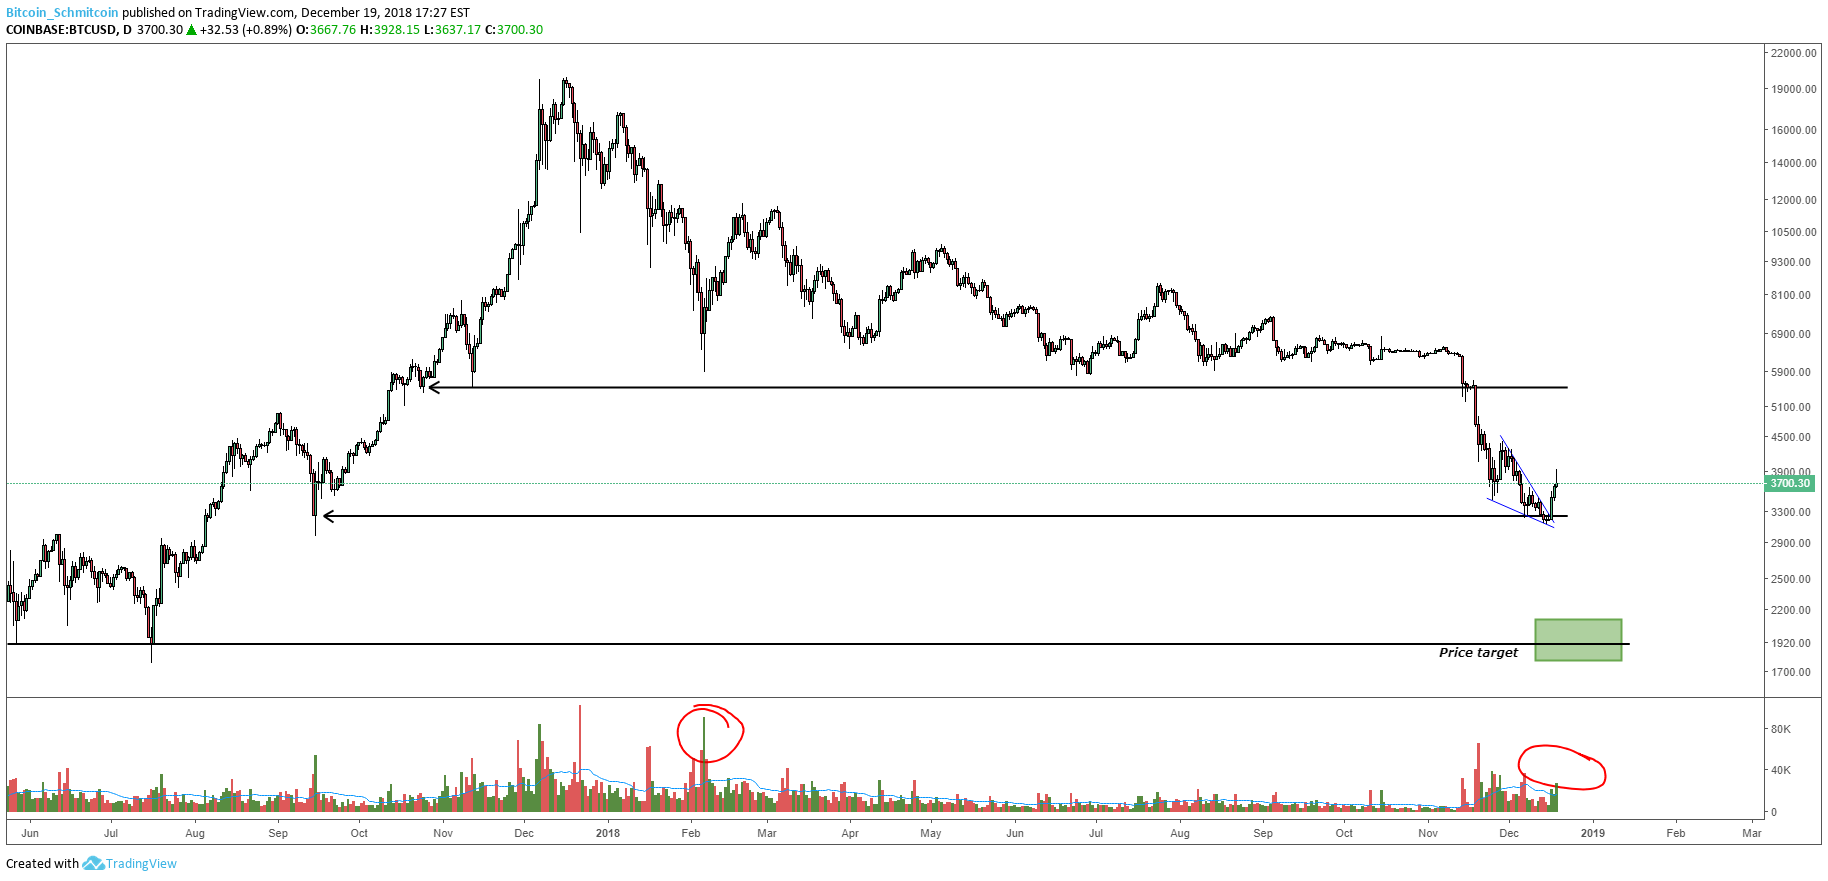 Figure 4: BTC-USD, Daily Candles, Volume Trend
If we manage to make another test of current support, there is very little helping the price for a long way down. And, if we manage to break current support, I fully expect to see some serious volume stepping in for long-term positions to be acquired.
Summary:
- Bitcoin has enjoyed a 25% rally over the last few days.
- At the top of its current rally, we see a Gravestone Doji setup that could potentially lead to a bearish reversal.
- We are testing known resistance on the 23% Fibonacci Retracement values, but it doesn’t look to have the strength to clear it at the moment.
- If we end up testing and breaking out of the current support level, there really isn’t much to keep the price aloft as we will have many eager bulls trapped and ready to be liquidated on any strong move to the downside.
Trading and investing in digital assets like bitcoin and ether is highly speculative and comes with many risks. This analysis is for informational purposes and should not be considered investment advice. Statements and financial information on Bitcoin Magazine and BTC Media related sites do not necessarily reflect the opinion of BTC Media and should not be construed as an endorsement or recommendation to buy, sell or hold. Past performance is not necessarily indicative of future results.
This article originally appeared on Bitcoin Magazine.