
Bitcoin Price Analysis: Understanding the BTC-USD Price Correction

Note: This analysis does not attempt to speculate on the market implications of news events. This is a pure analysis of the market data.
The unprecedented rise in the BTC-USD market to near $3,000 even caught many of the more bullish traders by surprise. However, this quick rise in value did not come cheaply: once BTC finally ran out of steam, the market correction not only affected BTC-USD prices, but it was felt throughout the entire crypto-space as entire market cap took a massive plunge from $49B to $36B over the course of three days.
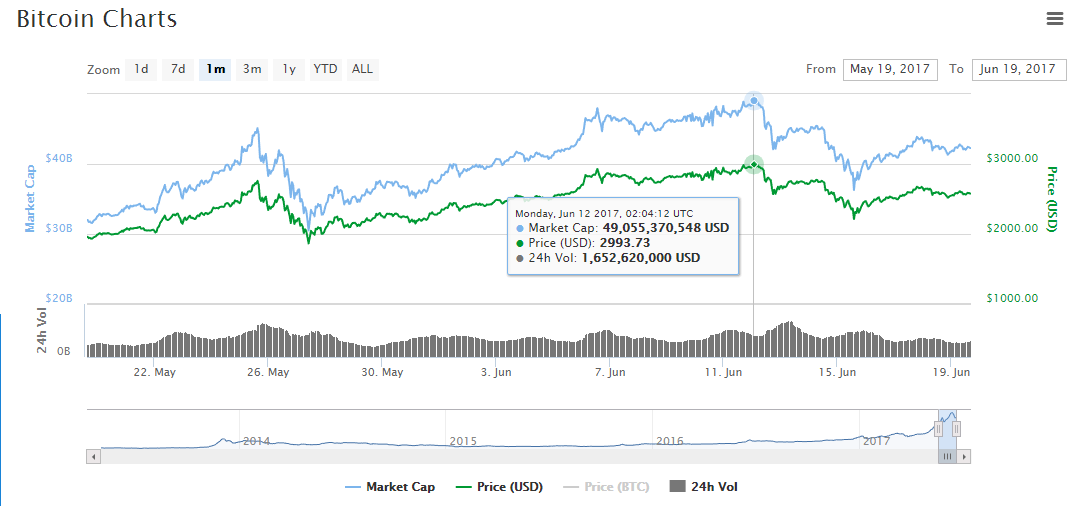
Figure 1: Market Cap Pre–Bitcoin Price Correction
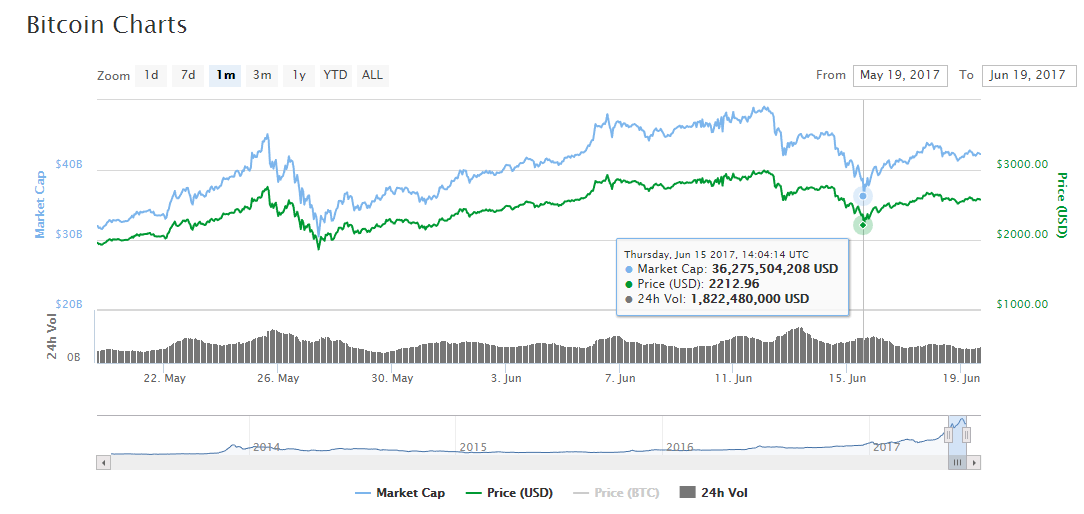
Figure 2: Market Cap Post–Bitcoin Price Correction
Why Did This Massive Price Correction Happen and Where Are We Heading?
There are two ways of viewing the BTC-USD run to near $3,000 levels:
-
The top can be viewed as the absolute top of the market ($2,948)
-
The top can viewed as the peak at $2,726.50 with a healthy 127 percent Fibonacci Extension
I’m going to analyze the market from the view of option 2 because I feel this provides a more sober outlook on the direction of the BTC-USD market. In strong Bull Runs, it is very common for markets to take a 50 percent correction; a 100 percent Retracement of the initial downward move (if it’s a very strong Bull Run), followed by a 127 percent Fibonacci Extension will provide another test to see how the market feels in the new market highs. In our case, we didn’t quite make it to the 127 percent Extension (shown in orange in Figures 3 and 4).
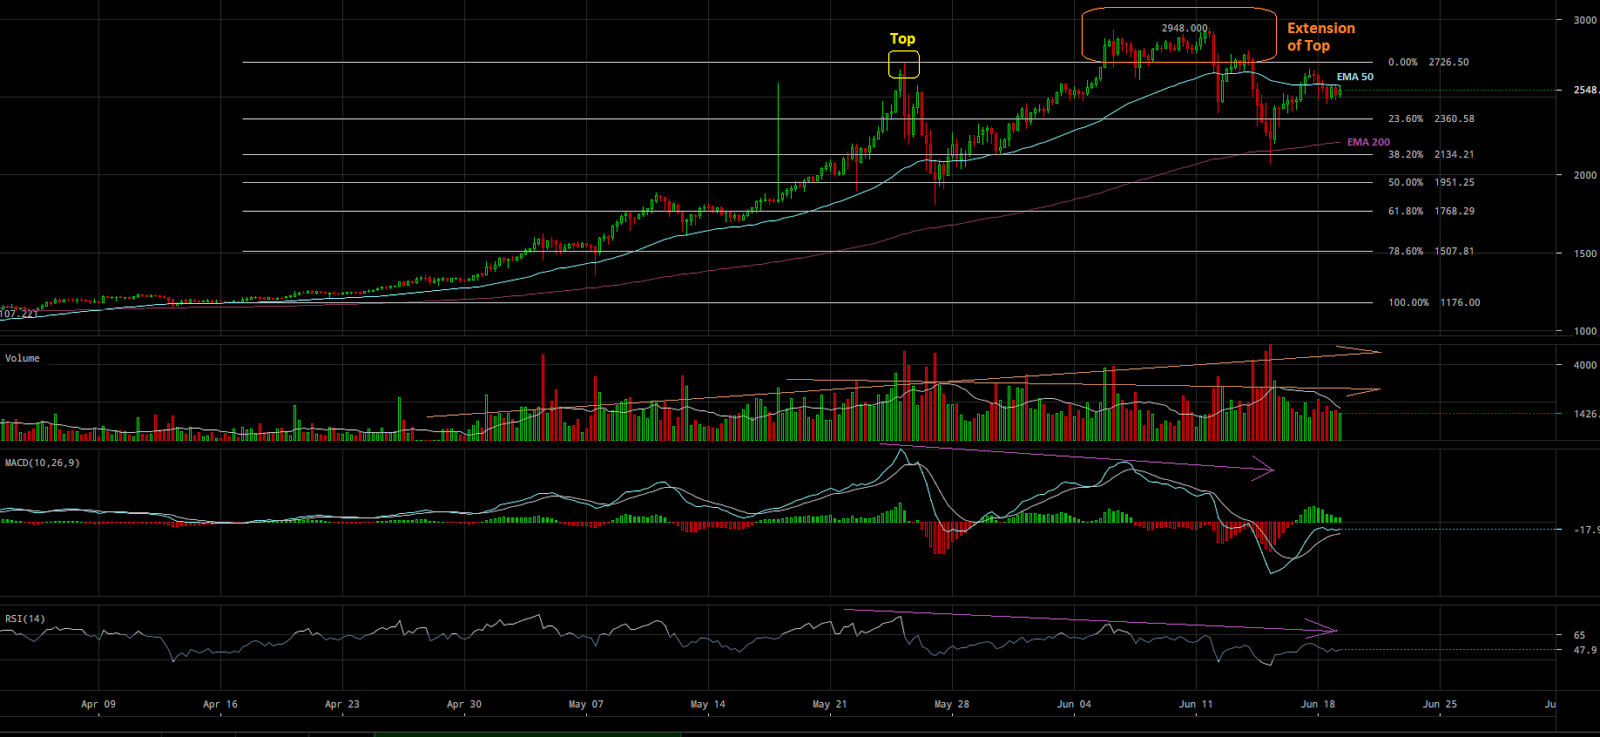
Figure 3: BTC-USD, GDAX, 6-hr Candles, the Relative Market Top With Accompanying Extension
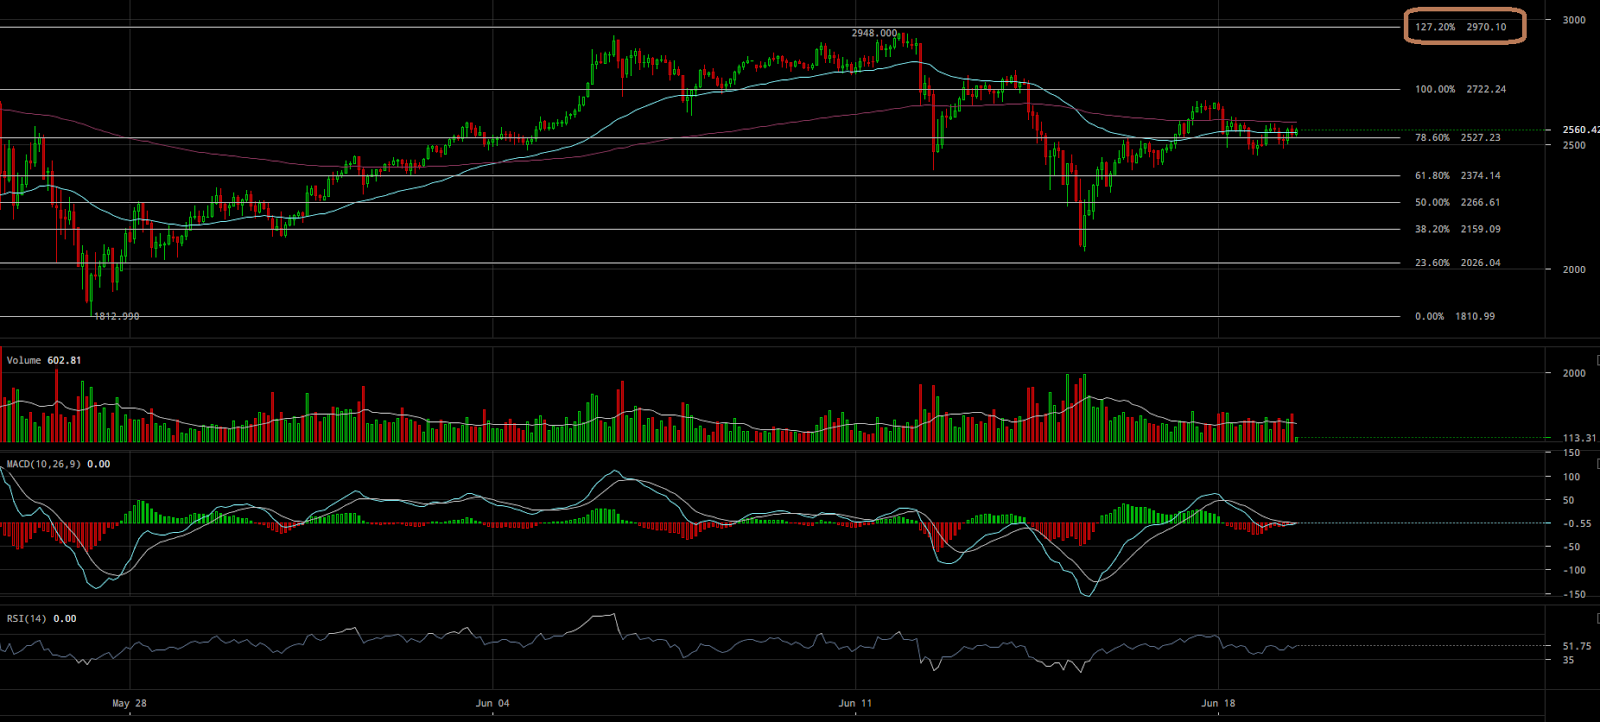
Figure 4: BTC-USD, GDAX, 2-hr Candles, Failed 127 Percent Fibonacci Extension
Currently, BTC-USD is finding support on the 50 percent Fibonacci Retracement of the Bear Run from $3,000 (labeled in green). It made a test of the 61 percent line (labeled in red) and it was ultimately rejected. This rejection and subsequent support test of the 50 percent line coincides with a decrease in volume and a near flip of the four-hour MACD from Bullish to Bearish (labeled in yellow). These market moves show that, unless significant volume hits the BTC-USD markets, there is a likely test of the lower Fibonacci Retracement Lines in its future.
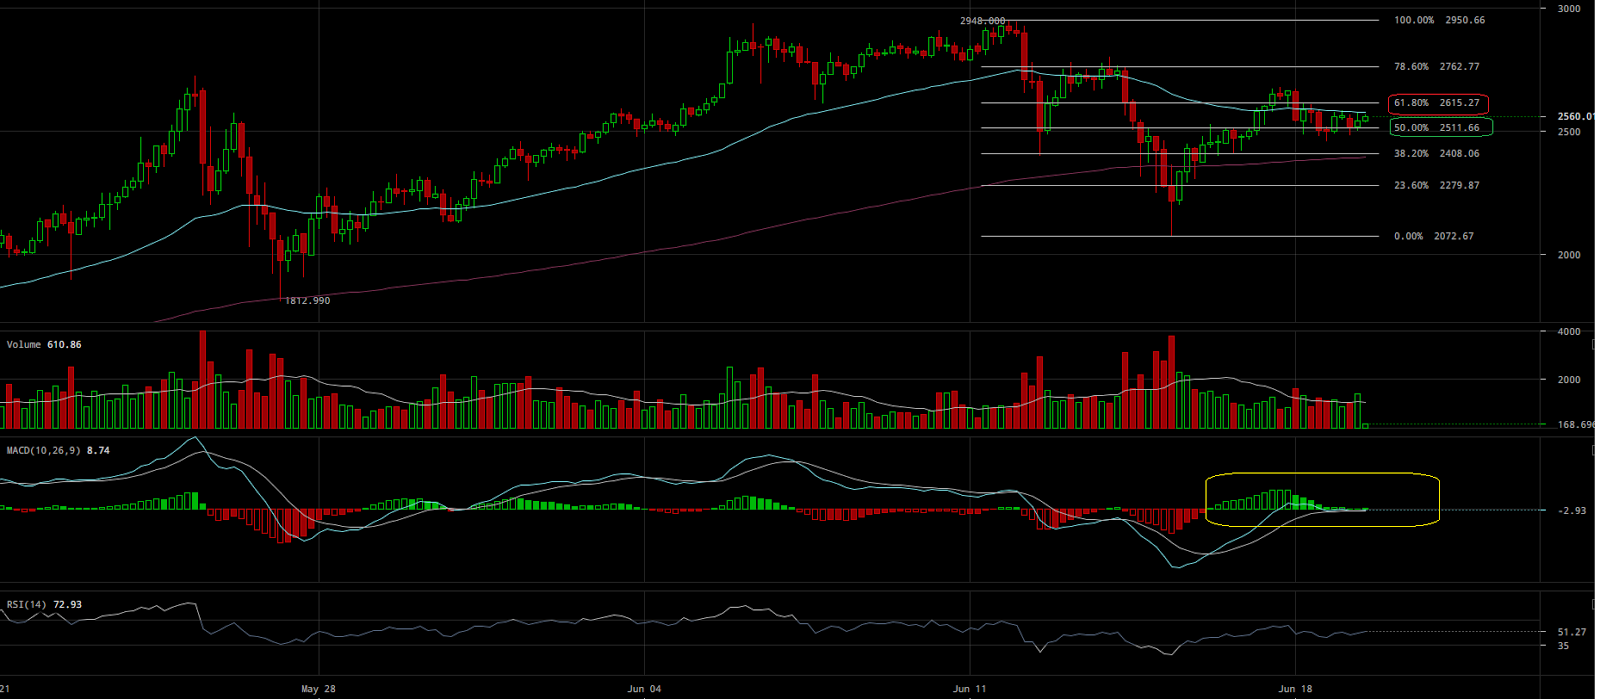
Figure 5: BTC-USD, GDAX, 4-hr Candles, Fibonacci Retracement of Bear Run
After our initial market high around $2,700, multiple momentum indicators began to reveal that, although the price was increasing, the market was beginning to lose upward momentum — this type of price activity is called “Divergence” and can be seen across the RSI, MACD and Volume. The long-term outlook for BTC-USD indicates a possibility of lower lows in its future. On the higher time-scales (refer to Figure 3), the momentum indicators are pointing toward more downward movement as the price is currently failing to make a new high and seeing decreased market volume. It’s totally possible that the market could move sideways or even see price growth on decreasing volume — markets aren’t always rational. However, if you want to know whether the price growth is sustainable and reliable, keep an eye on the momentum indicators and watch for volume to accompany price growth in the coming days. For the time being, I find it very unlikely that BTC-USD will see any significant price growth. But, after all, this is cryptocurrency; anything is possible.
Summary:
-
Short-term indicators are showing a possible move to the lower Fibonacci Retracement values ($2,500, $2,400, $2,280).
-
Long-term indicators are showing a loss of upward momentum. Until more volume hits the markets, very little price growth is likely.
Trading and investing in digital assets like bitcoin and ether is highly speculative and comes with many risks. This analysis is for informational purposes and should not be considered investment advice. Statements and financial information on Bitcoin Magazine and BTCMedia related sites do not necessarily reflect the opinion of BTCMedia and should not be construed as an endorsement or recommendation to buy, sell or hold. Past performance is not necessarily indicative of future results.
The post Bitcoin Price Analysis: Understanding the BTC-USD Price Correction appeared first on Bitcoin Magazine.