
Bitcoin Price Analysis: Wait and See Where Recent Signs of Strength Lead

This week realized a big gain as bitcoin enjoyed a 25% rally from its local bottom before topping out around $4,400. Support currently appears to be established in the mid-$3,000s as the market remains indecisive over its next move:
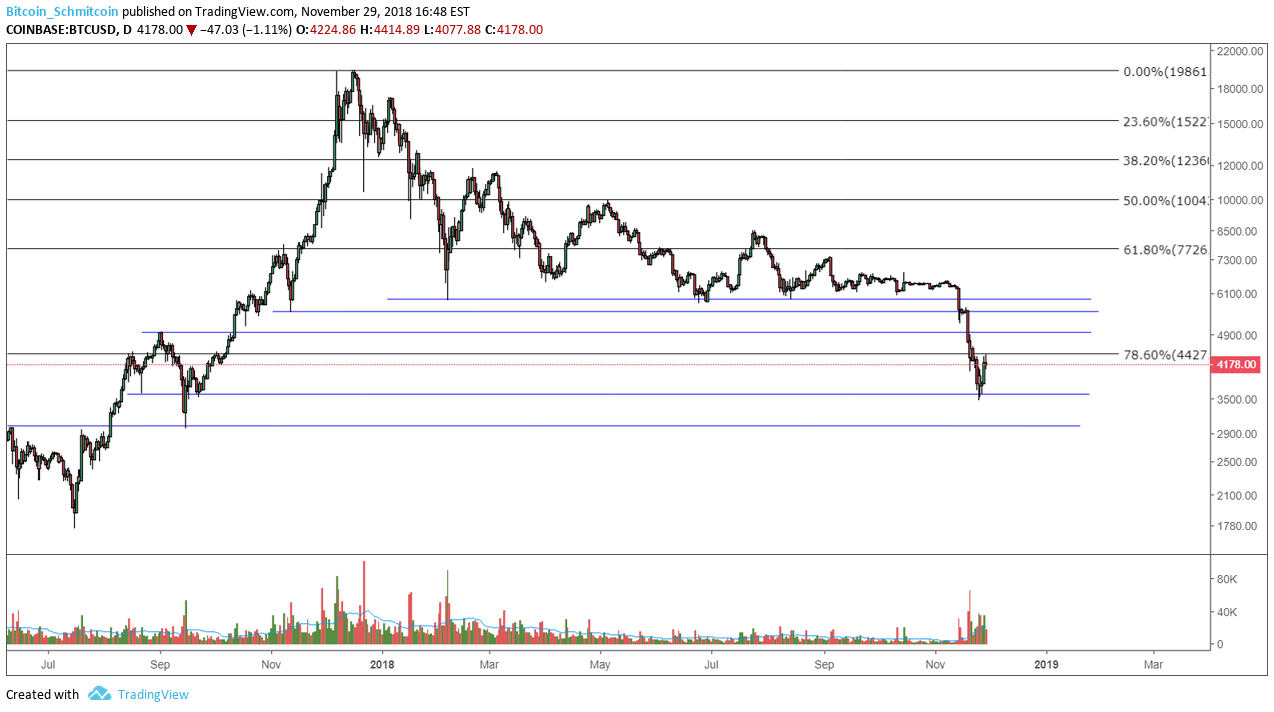 Figure 1: BTC-USD, Daily Candles, Current Support Level
Figure 1 shows the relevance of the current support level as it represents a previous support level that was never properly retested during last year’s parabolic bull market. At the moment, we are currently seeing some resistance around the macro, 78% Fibonacci retracement of the parabolic run-up. To date, bitcoin has realized a whopping 82% devaluation from its all-time high to the current low in the mid $3,500s.
If our current support holds, we should expect to see a battle over the 78% retracement values where, if the overhanging retracement level breaks, we will likely encounter another level of resistance in the $5,000 region. But, for now, the market needs to tackle the 78% Fibonacci before worrying about the overhanging resistance levels.
On the lower time frames, we can see bitcoin is finding nice support on its 23% retracement which also happens to be the previous high:
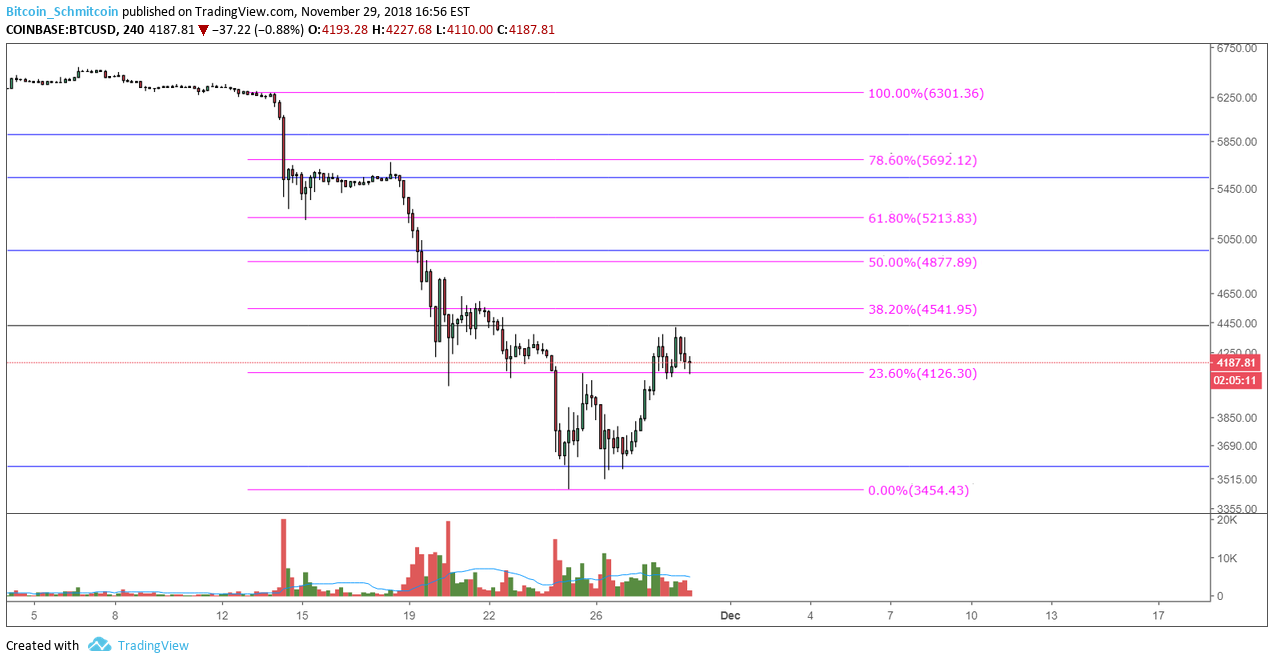 Figure 2: BTC-USD, 4-Hour Candles, Current Low Time Frame Support Level
The lower time frames are consolidating on top of the previous high and just below the macro 78% retracement. Off the $3,500 low, we saw a decently strong rally with high volume and wide spread indicating strength on the demand side. The ability to hold this current level is a temporary bullish sign that the bears may be taking profit and eager bulls are jumping in to ride a potential rally upward.
At the time of this article, bitcoin is up over 20% from its local low and the bulls appear to be taking a stab at the market following the previous brutal 60% drop. For now, the market is in a kind of sit-and-wait zone while we sit and observe how the market reacts to its newfound support and resistance levels.
If we manage to break through current support, we can expect to see a retest of the mid $3,500s. If that level doesn’t hold, we can then expect to see a drop down to the low $3,000 values:
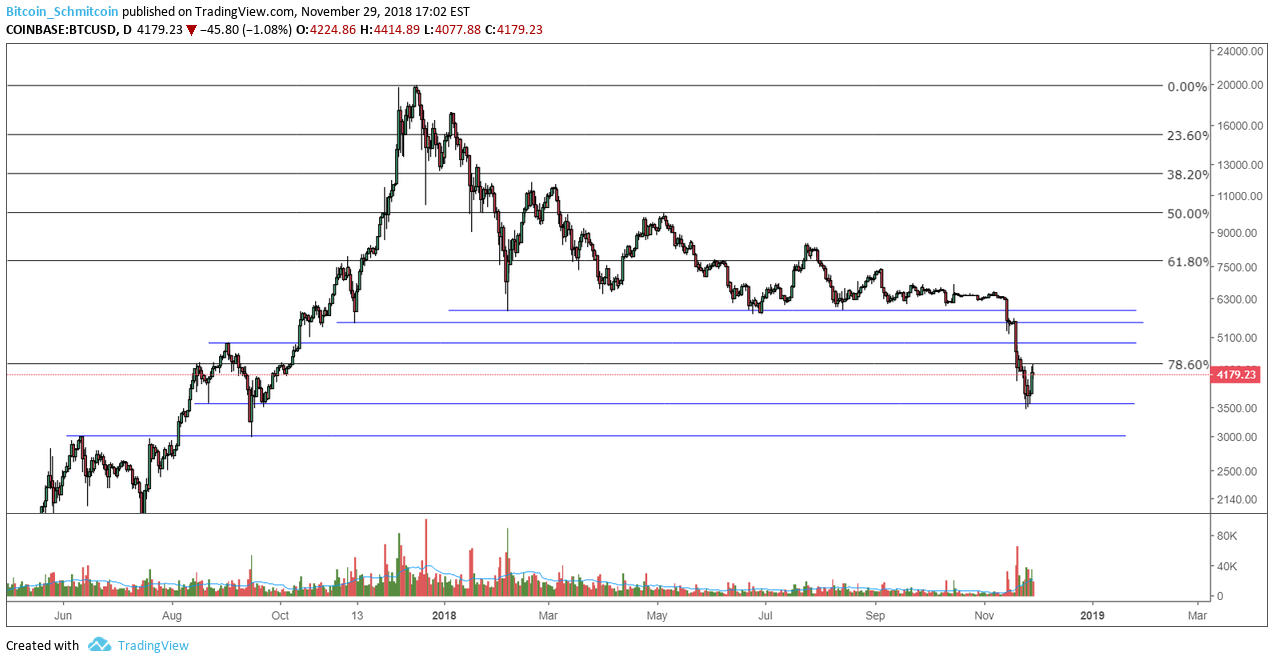 Figure 3: BTC-USD, Daily Candles, Lower Support Levels
The low $3,000s represent the previously established support level during last year’s bull market and we have yet to retest the support zone. As I mentioned, the current price level is in a wait-and-see level and we need to see how the current support and resistance level holds over the next few days.
Summary:
- After bottoming out around $3,500, bitcoin enjoyed a near 25% rally where it is currently testing the resistance of its macro 78% retracement.
- On lower time frames, bitcoin is seeing a decent sign of strength as the demand appears to be relatively high and the candle spread is wide.
- The current price level calls for observation while we wait and see how the current support and resistance levels are received over the next few days.
Trading and investing in digital assets like bitcoin and ether is highly speculative and comes with many risks. This analysis is for informational purposes and should not be considered investment advice. Statements and financial information on Bitcoin Magazine and BTC Media related sites do not necessarily reflect the opinion of BTC Media and should not be construed as an endorsement or recommendation to buy, sell or hold. Past performance is not necessarily indicative of future results.
This article originally appeared on Bitcoin Magazine.