
Bitcoin Price Breaches The $353 Resistance Level – $400 Is Inevitable!!!
Bitcoin price has just exceeded $360 less than an hour, before writing this article. As last week’s bullish wave continues to build up, the 2 and 4 hourly charts continue to print higher highs. As I looked through the 1 -2 hourly charts and the 1 day charts, I detected a few signs signaling continuation of this new uptrend, especially, that the price will not face any significant resistance all the way up to $416.
Key Resistance Points:
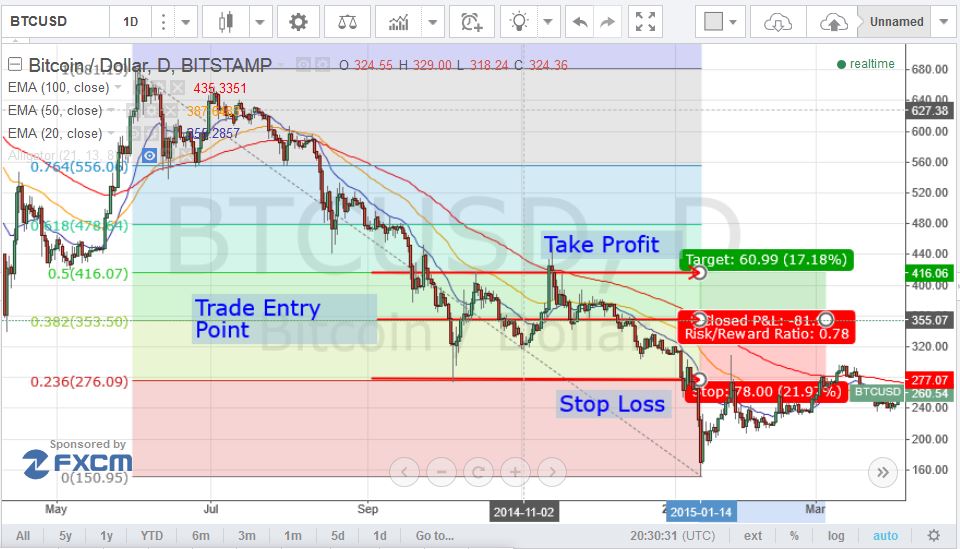
Let’s take a look at the 1 day (BTC/USD) charts from Bitstamp and plot the 20, 50 and 100 EMAs (look at the below chart) . We can conclude the following:
- To better visualize support and resistance levels at this point, we shall plot a Fibonacci retracement between the high recorded in May 2014 ($680) and the low recorded in January 2015 ($159.5). Accordingly, we can see that now BTC price has breached the resistance level at $353.5, which corresponds to the 0.382 Fib retracement level, and it won’t face any significant resistance except at $416.07, which corresponds to the 0.5 Fib retracement level.
- Entering a long trade at around $350 with a take profit near $415 and stop loss at around $380 can be highly profitable now and has a low risk/reward ratio.
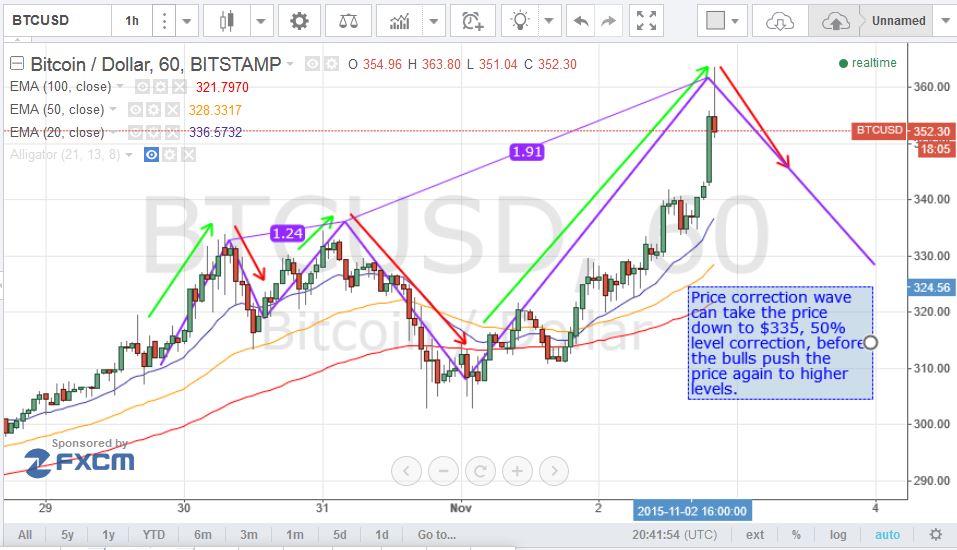
By studying the 1 hour (BTC/USD) charts from Bitstamp (look at the below chart) and plotting the 20, 50 and 100 period EMAs, we can conclude the following:
- Since the bullish wave has started last week, the one hour charts have formed a “Three Drivers Pattern” as shown by the 3 violet pyramids on the below chart; each advancement wave is followed by a price correction wave that pulls the price down before the bulls take over the market again and push the price to higher levels. Accordingly, although we expect BTC price to test the $416 resistance level soon, this will mostly be proceeded by a price correction wave that will take the price down to around $335 (around 50% price correction) within the next few hours or so.
- The bullish wave is usually halted whenever the price drops below the 20 period EMA as shown on the below chart, so as the price is now above it ,we expect to see higher prices within the next few days.
- As per the Fib retracements we plotted earlier, BTC won’t face any significant resistance except at $416, so we expect the bulls to push the price up to attempt to test this crucial resistance level soon.
Conclusion:
As BTC price breached the resistance level at $353.5, we are most likely going to see it rise to attempt testing the resistance at $416 within the next 48 hours.
Charts from Bitstamp, hosted on Tradingview.com
The post Bitcoin Price Breaches The $353 Resistance Level – $400 Is Inevitable!!! appeared first on NEWSBTC.