
Bitcoin Price Breaks, Range Then Holds; What’s Next?
This morning we published our twice-daily bitcoin price watch analysis piece. In the piece, we speculated that – while we had seen some volatility overnight in the bitcoin price – we may get the breaking of a range during today’s action, and if so, we suggested a couple of the levels we would be keeping an eye out for as far as potential medium-term intraday targets were concerned. Action has now matured throughout Friday’s session, and we are heading into the weekend. What are the levels we will be looking for this evening, and how might we draw profit from the market before the start of a fresh week on Monday? Take a quick look at the chart.
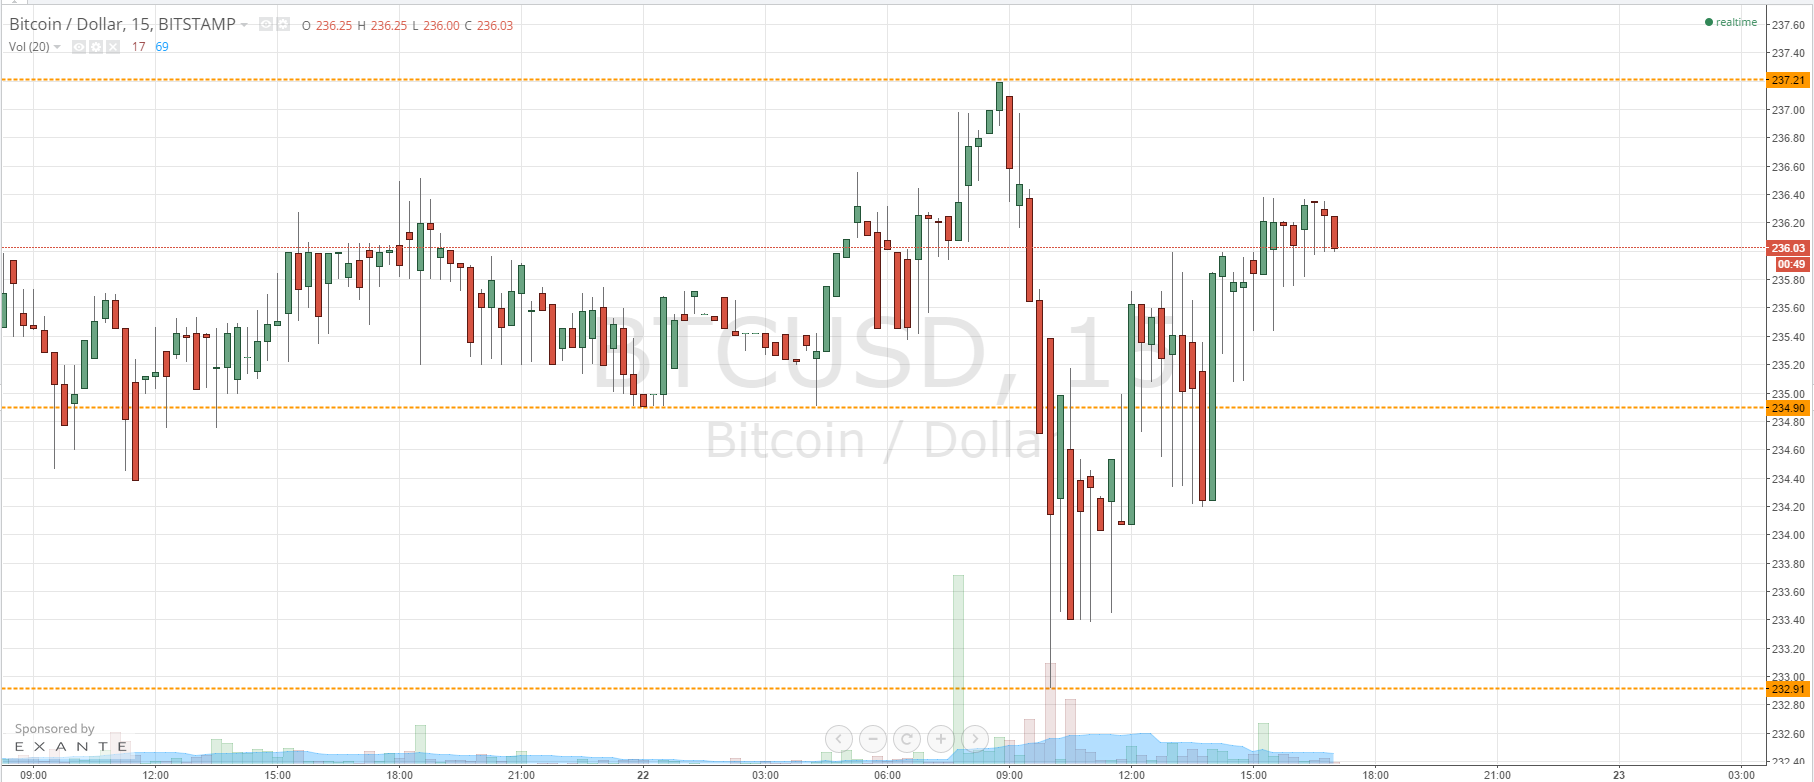
As the chart shows, action today saw a steep decline in the bitcoin price pretty much as soon as we had published our first piece, and a break through in term support at 234.9 put us short towards our downside target. We did not quite reach our target, however, and we were taken out of the trade on a bias reversal as we entered back to trade within range this afternoon. As such, the levels we are keeping an eye on now are 234.90 (in term support) and 237.21 (in term resistance).
We are currently trading mid-range, so we don’t have a particular bias for price at this moment. If we run up towards 237.21 – and get a break above this level on an intraday basis – it would put us long towards 240 flat, with a stop somewhere around 236.60 taking us out of the trade in case price breaks against us. Looking the other way, if we get a break below 234.90, we will enter short with a target of 232.91 (today’s floor and daily lows) and a stop somewhere around current levels – 236 flat would do nicely.
Charts courtesy of Trading View