
Bitcoin Price Hinges on $503 – Igniting Downside Price Correction!!
Bitcoin price printed a high of $503 earlier today on Bitstamp, then a price correction wave pulled it down to $470 , at the time of writing of this article. The historical bullish rally that we witnessed during the past few days will slow down during the next couple of days, as the price seems to have hinged around the $500 level to ignite a temporary reversal of this bullish wave.
Bollinger Bands Signaling Price Correction Attempts:
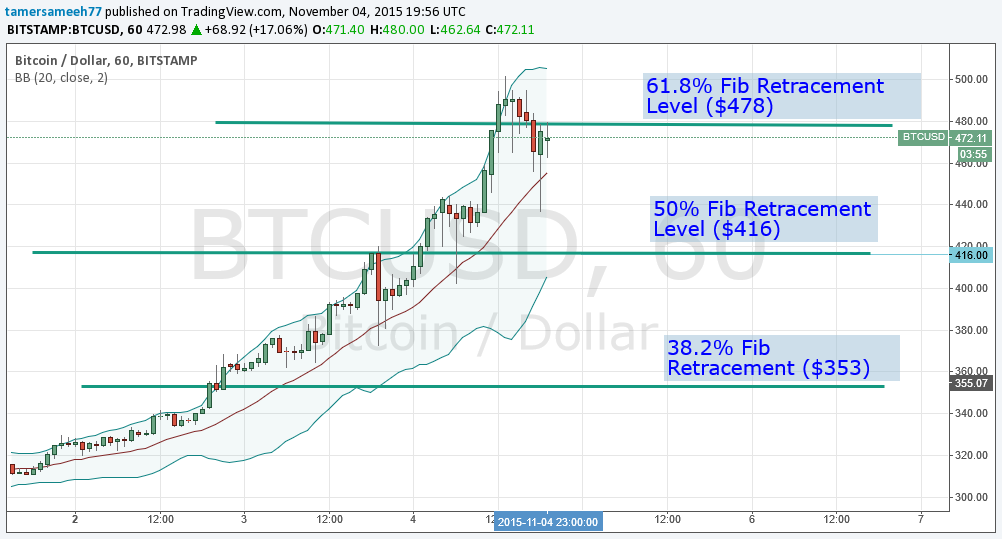
Let’s examine the 1 hour (BTC/USD) charts from Bitstamp (look at the below chart) ; plot the “Bollinger Bands” volatility indicator and extend the Fibonacci retracement levels we plotted on our analysis on the 2nd of November:
- Bitcoin price overshot above the 61.8% Fib retracement level at $478, before the uptrend started reversing and price dropped down to print a low of $436.5 a few hours ago. Accordingly, the $478 level is a significant resistance level that is preventing further advancement of the bullish wave.
- The Bollinger Bands can be used as a tool that signals minor downwards price correction waves, as we can see on the below chart that once the price rose above the upper band, the trend was reversed and bitcoin price started dropping. This also happened yesterday when the price touched the 50% Fib retracement level and rose above the upper Bollinger band, a downwards price correction wave was ignited to pull the price back down below the upper band.
Bearish reversal on 4 Hourly Charts:
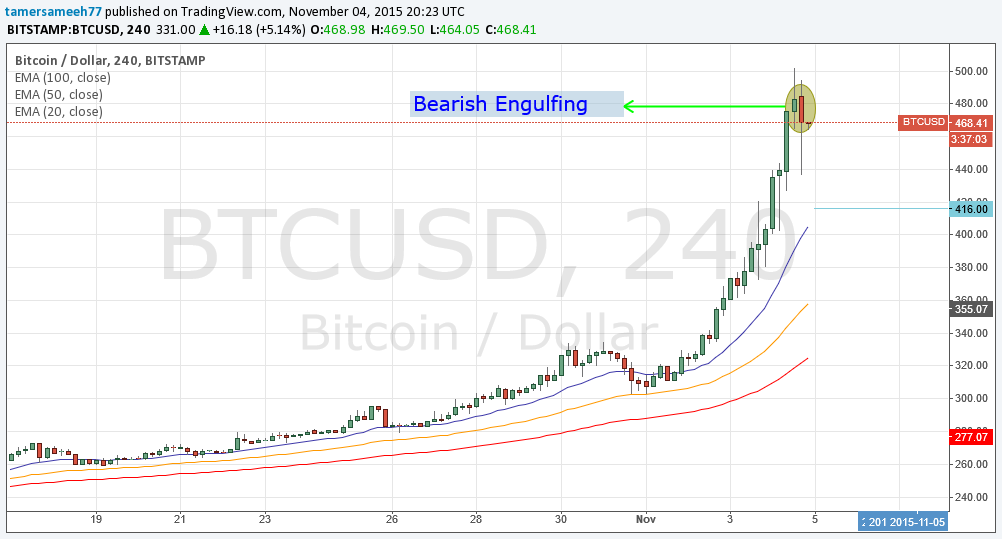
By studying the 4 hour (BTC/USD) charts from Bitstamp (look at the below chart) and plotting the 20, 50 and 100 period EMAs, we can conclude the following:
- We can spot a “Bearish engulfing” pattern (look at the 2 candlesticks inside the grey ellipse on the below chart). The bearish red candle totally engulfs the bullish greenish candle which signaled a reversal of the uptrend throwing the price down below $340 earlier today.
- The price is still above the 20, 50 and 100 period EMAs which means that generally speaking, the bullish wave can continue to push the price to higher level after a brief downside price correction attempt, which can take the price down to test the support level at $353.
Conclusion:
Bitcoin price exceeded $500 earlier today, before a downside price correction pulled the price to a low of $436.5. It seems that the bulls will take control over the market again after a brief downwards price correction attempt.
Charts from Bitstamp; hosted by Tradingview.com
The post Bitcoin Price Hinges on $503 – Igniting Downside Price Correction!! appeared first on NEWSBTC.