
Bitcoin Price Rockets; Yearly Highs Next?
It seems that every day over the past couple of weeks we have seen strength in the bitcoin price. When we spiked down through the $200 mark at the end of August, it looked as though bitcoin was in for a tough final quarter – how quickly things change. A look at the daily chart reveals just two days of decline from the last 19 days of action, and we are now trading just shy of 2015 highs. One more push up and we could carve out fresh highs – something that in itself could translate to some further upside momentum going forward. So, with this said, let’s take a look at the levels we are watching for this evening’s Asian session, and see if we can’t draw a scalp profit from the markets against the backdrop of wider market strength. Take a quick look at the chart.
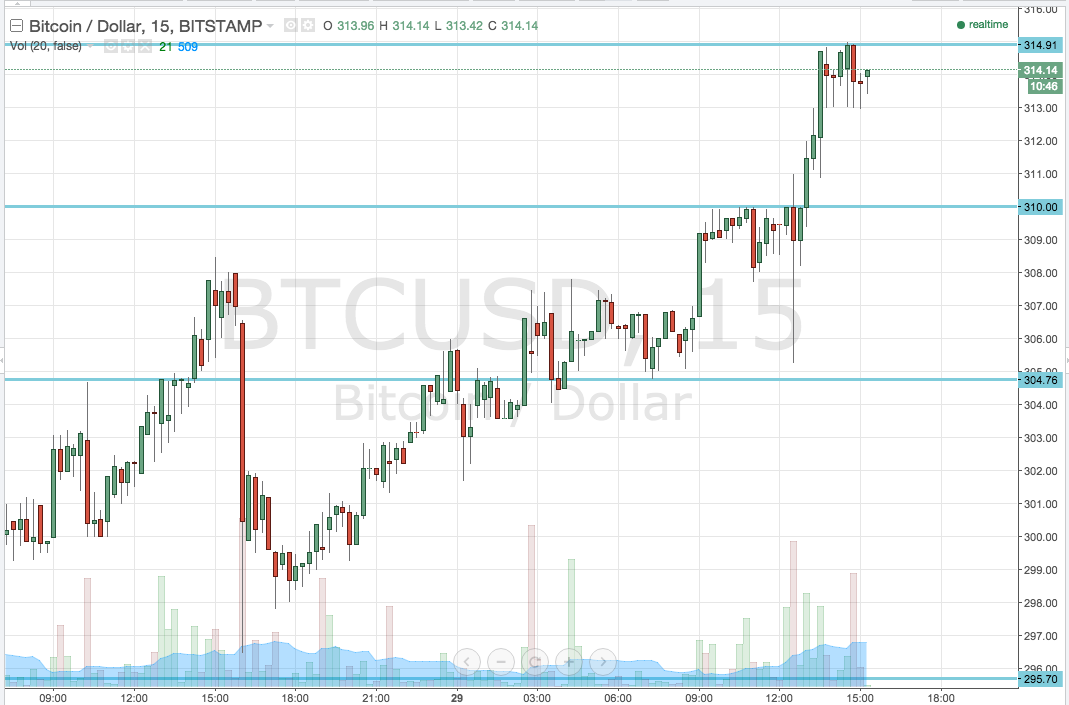
As you can see, the levels we are looking at this evening are in term support at 310 flat, and in term resistance at 314.91. With the current momentum being to the upside, we are going to focus on resistance first. A break above 314.91, flowed by a close above this level on the 15min chart (illustrated) would put us in a long trade towards a medium term target of 320 flat. Keep in mind that this is circa annual highs, so if we do reach 320 we will probably see a short term correction as speculative traders book profits on their long positions. A stop loss on this one somewhere around 312.5 gives us a decent risk/reward profile.
Looking the other way, if we correct before the breakout, we will look for a close below in term support at310 flat to bring 304.76 in to play to the downside. A stop loss somewhere around 312 flat will define our risk on the trade.
Charts courtesy of Trading View
The post Bitcoin Price Rockets; Yearly Highs Next? appeared first on NEWSBTC.