
Bitcoin Price Technical Analysis for 28/12/2015 – Watch These Resistances
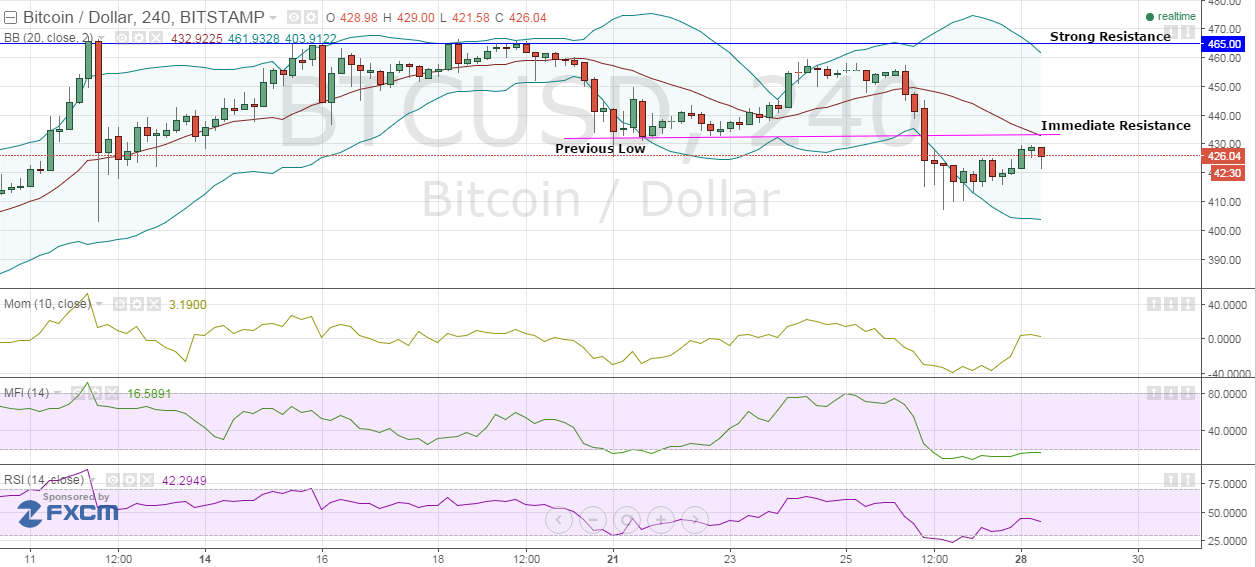
Bitcoin is currently staging a weak technical rebound from lows of $410, but the cryptocurrency faces two resistances which might stall the recovery process. The previous bottom of $433 is expected to act as the primary or immediate resistance. The level of $465 remains a major hurdle for bitcoin.
Bitcoin is trading at $426.04, adding to yesterday’s gains.
There are other technical indications as well which the market participants should be aware of. We will analyze the 4-h BTC-USD price chart from BITSTAMP to discuss them.
Bollinger Bands – Bitcoin survived the abrupt fall with support from the lower range of the BB. The 20 4-h SMA also coincides with the resistance posed by the previous bottom. This strengthens the level of $433 as a blockade.
Momentum – The Momentum indicator is witnessing a deceleration in its upmove. The latest value of 3.1900 should be seen with a cautious eye.
Money Flow Index – One surprising aspect of the recovery is the sustenance of extremely low MFI readings. The current value of 16.5891 even when the price has rebounded by more than 4% from lows signals the underlying bearishness.
Relative Strength Index – The latest RSI value is 42.2949. Market participants should look consistent readings north of 50 before becoming bullish on bitcoin.
Conclusion
The Christmas didn’t turn out to be merry for the bulls, and it looks like that with the majority of the market participants enjoying the year-end festivities, the cryptocurrency might not cross $465 in haste.
The technical indicators are clearly reflecting the bearish undertone. I expect a broad range of $400-465 for bitcoin until the end of next week. Short bitcoin if the price reaches $465 or if it breaks the crucial support of $400. Long positions can be considered above $433 for a target of $455.
The post Bitcoin Price Technical Analysis for 28/12/2015 – Watch These Resistances appeared first on NEWSBTC.