
Bitcoin Price Technical Analysis – Headed for $300?
Bitcoin Price Key Highlights
- Bitcoin price has slowly been gaining ground against the U.S. dollar, thanks to weaker expectations of a Fed interest rate hike before the end of the year.
- Price is moving inside an ascending channel forming on the longer-term time frames, suggesting that bullish momentum is just getting started.
Bitcoin price is stalling at an area of interest near the moving averages but might be able to sustain its upside momentum after bouncing off the channel support.
Resistance at $280
Price is currently testing resistance near $280, as this lines up with the dynamic inflection points near the moving averages as well as a former support region. However, bitcoin has broken past last month’s highs, reflecting that bulls are charging.
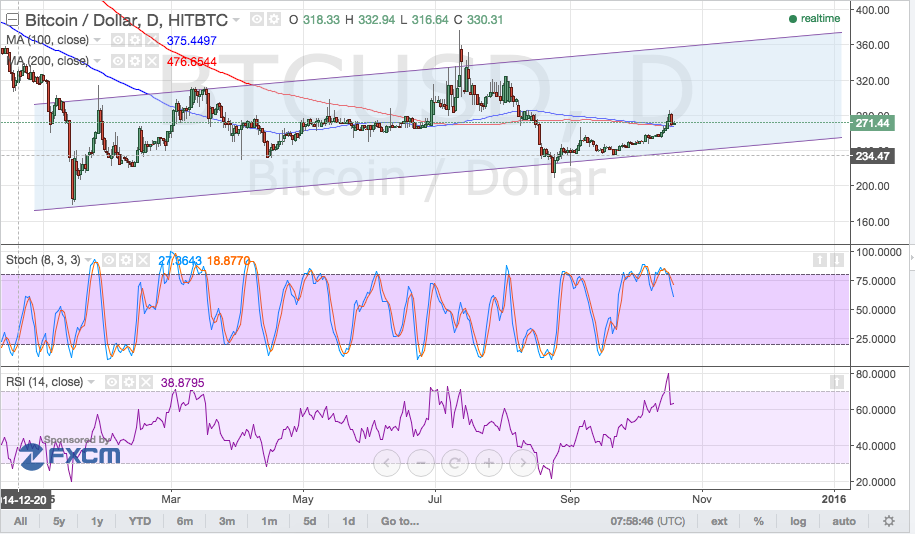
An upside break past the moving averages and $280 resistance level could signal that more buyers are in the game and are likely to keep the rally going until the $300 level.
However, stochastic is already moving down from the overbought zone, hinting that the rally is already exhausted. Similarly, RSI is turning lower from the overbought region, which means that sellers could come into play in the meantime. In that case, a test of the previous month highs at $265-267 could be in order before the climb resumes.
Intraday support level – $265
Intraday resistance level – $300
Charts from TradingView
The post Bitcoin Price Technical Analysis – Headed for $300? appeared first on NEWSBTC.