
Bitcoin Price Watch; The Weekend Ahead
We’re about to shut down our analysis for the weekend, but before we do, let’s take one more look at the bitcoin price, in an attempt to set up against any potential volatility that comes this evening and, beyond that, into the weekend. The chart below shows action across pretty much the entire week.
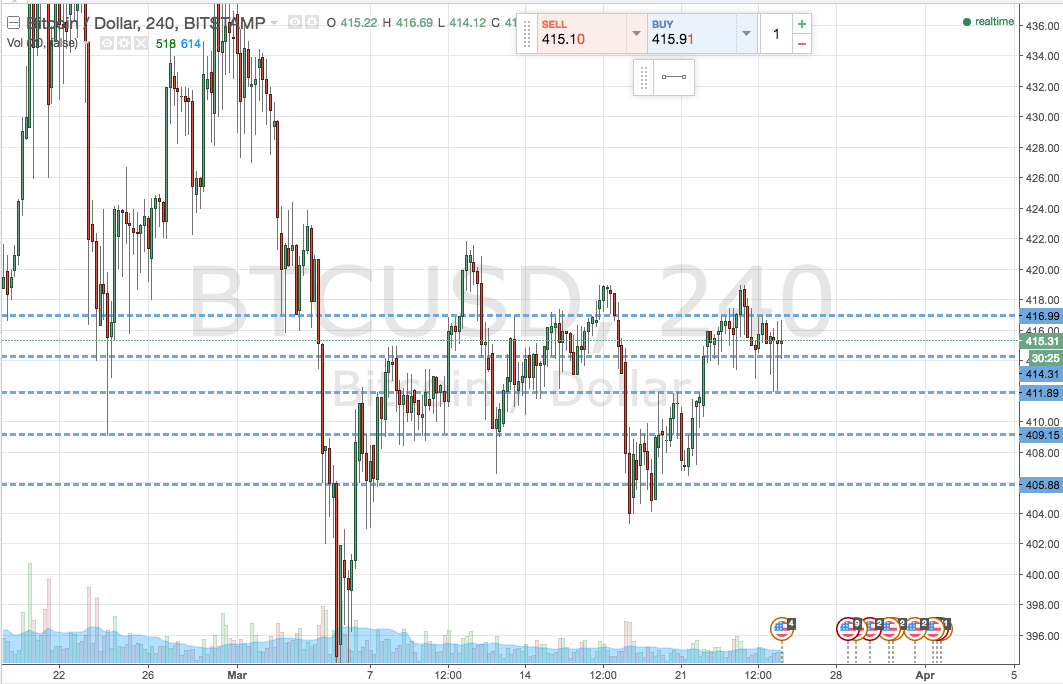
As you can see (and ignore the blue highlights for now, these will come into play when we zoom in to the intraday chart shortly) action was pretty volatile at the beginning of the week, declining sharply, and has since chopped about in a pretty tight, ten dollars or so, range. We’re currently trading at the high end of this range, suggesting we could be in for a near term decline if the range resistance holds and we see a correction.
Ok, now we’ve looked at that, let’s zoom into the intraday chart and try to outline what we are focusing on this evening. The chart below shows the action throughout today’s session, and illustrates the framework we placed on the bitcoin price this morning. It’s a fifteen-minute candlestick chart. Take a quick look.
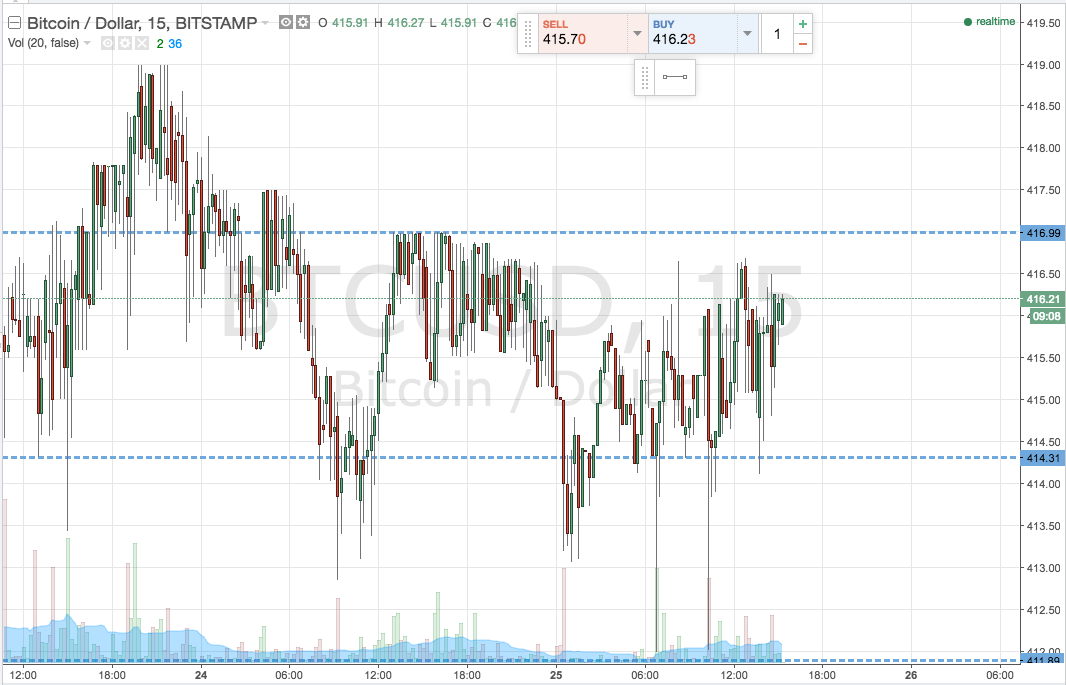
As you can see, and the first thing that readers of this morning’s analysis will notice, the framework we have been watching all day remains in place. Specifically, in term support at 414.31, and in term resistance at 417 flat.
Because things are unchanged (we got in to a trade a little earlier but quickly got taken out on a spike to the downside), we are going to hold our targets and risk parameters as is going forward – with one exception, our downside take profit.
The wider timeframe analysis suggests we are in for a short side correction, so we’re going to be a little bit more aggressive with our downside target. Specifically, a close below in term support will signal a short entry to 408 flat, stop as defined earlier.
Charts courtesy of Trading View
The post Bitcoin Price Watch; The Weekend Ahead appeared first on NEWSBTC.