
Bitcoin Price Weekly Analysis: BTC/USD Could Test $6,390 Before Lower
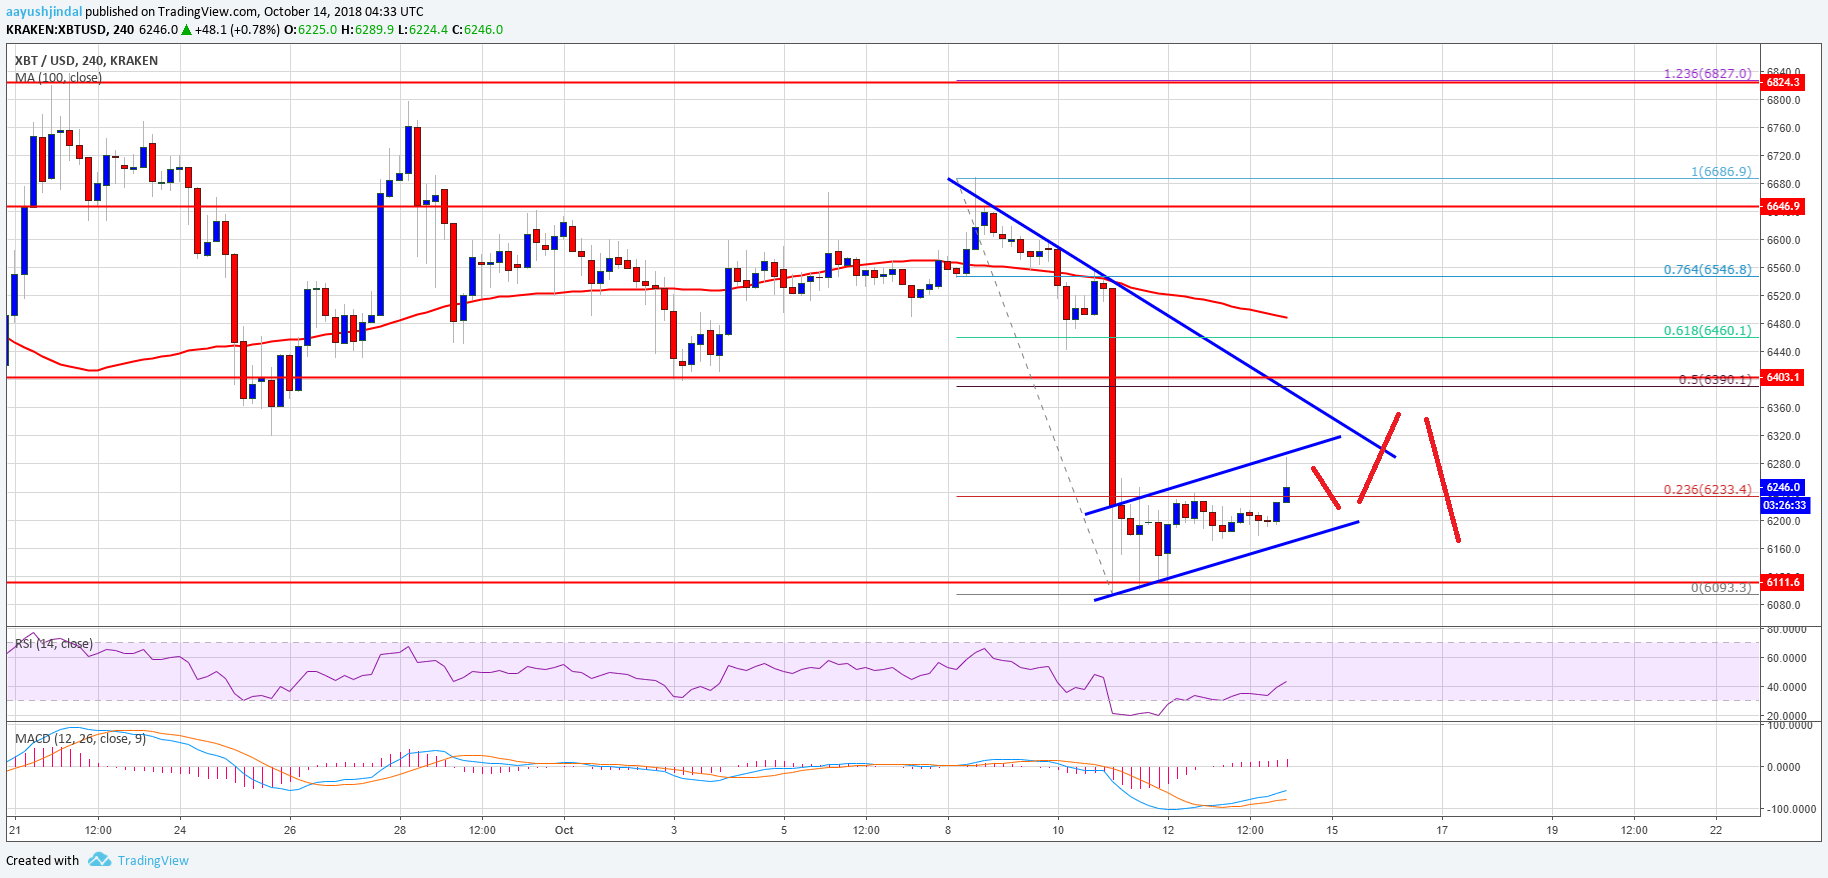
Key Points Bitcoin price is currently correcting higher against the US Dollar. BTC/USD is likely to face a strong selling interest near the $6,380-6,390 resistance area. This past week, bitcoin price saw a solid increase in selling pressure around the $6,600 zone against the US Dollar. As a result, there was a nasty decline and the BTC/USD pair fell below the $6,400 and $6,200 support levels. The price traded towards the $6,100 level and formed a low at $6,093. Later, the price started an upside correction and moved above the $6,200 resistance. There was a break above the 23.6% Fib retracement level of the last slide from the $6,686 high to $6,093 low. At the outset, it is following an ascending channel with resistance at $6,320. Above this, there is a major bearish trend line in place with resistance at $6,325 on the 4-hours chart of the BTC/USD pair. Finally, the $6,380-6,390 is a crucial resistance zone (the previous support). It also represents the 50% Fib retracement level of the last slide from the $6,686 high to $6,093 low. Therefore, if the price continues to move higher, bitcoin buyers are likely to struggle near the $6,380-6,390 zone. Looking at the chart, BTC price needs to settle above $6,380-6,390 and then $6,400 to move into a positive zone. If it fails, there could be a fresh downside move back towards the $6,200 and $6,100 supports. Below these supports, the price could be at a risk of a bearish break below the $6,000 handle. Looking at the technical indicators: 4-hours MACD – The MACD for BTC/USD is slowly moving in the bullish zone. 4-hours RSI (Relative Strength Index) – The RSI is currently just above the 40 level. Major Support Level – $6,100 Major Resistance Level – $6,390
Bitcoin Price Analysis
The post Bitcoin Price Weekly Analysis: BTC/USD Could Test $6,390 Before Lower appeared first on NewsBTC.