
Ether Price Analysis: Eve and Adam Could Be Turning Back the Bulls

Since bottoming out around $200, ether has spent several weeks bouncing back and forth inside an ascending channel:
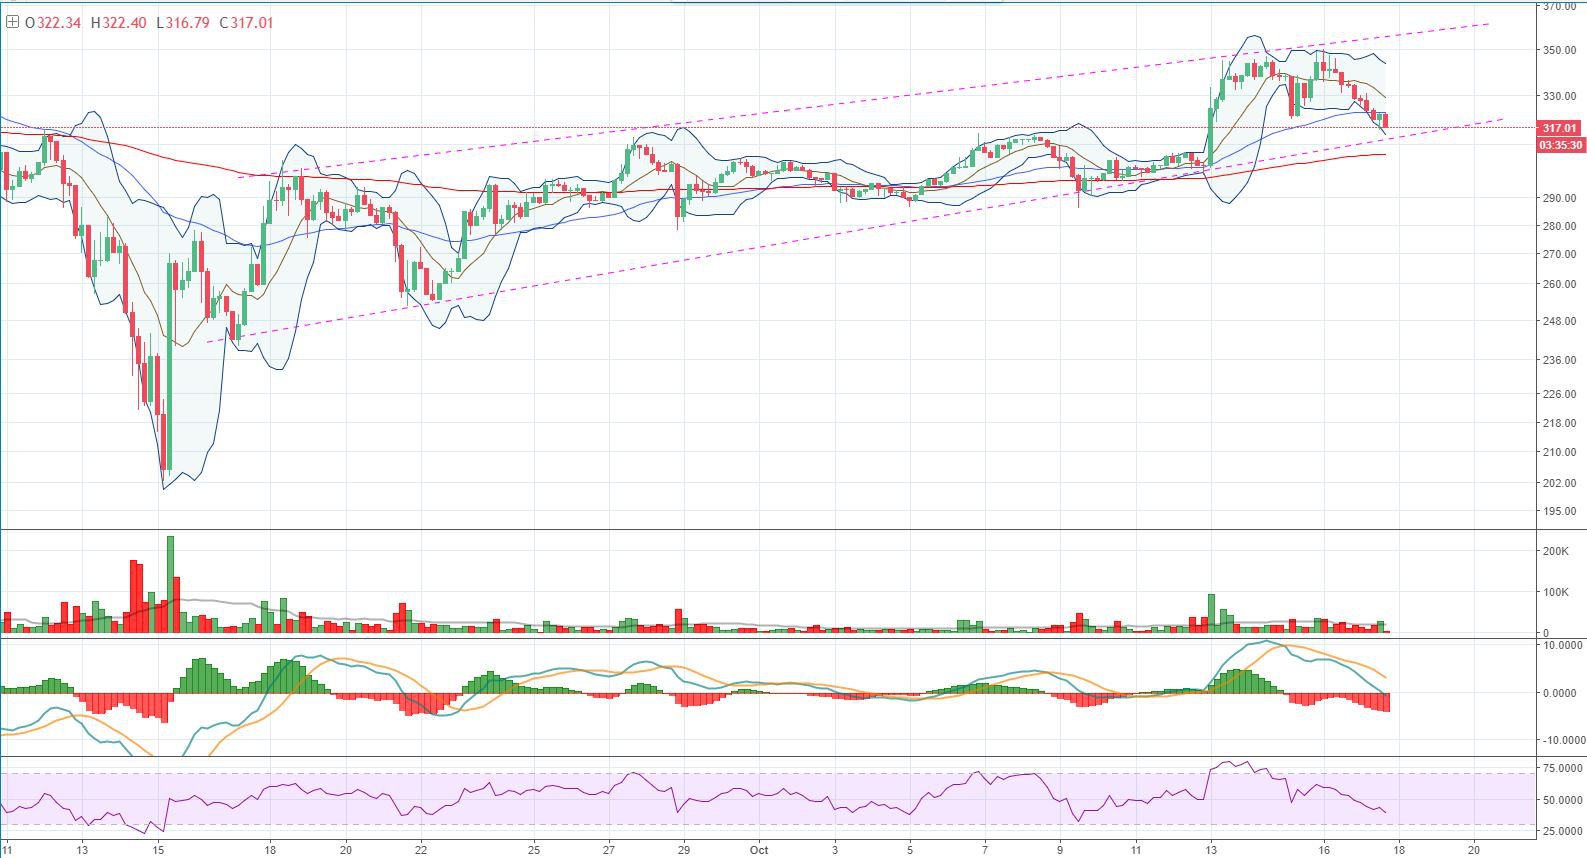 Figure 1: ETH-USD, 4-Hour Candles, Ascending Channel
For the last month and a half, ether’s trend has been contained within the bounds of this ascending channel, where it has continued its bullish rally. However, today (as of the time of this article) it is starting to make moves to aggressively test the lower boundary. Specifically, as ether tests this channel, it is forming a potential reversal pattern called an Eve-and-Adam Double Top.
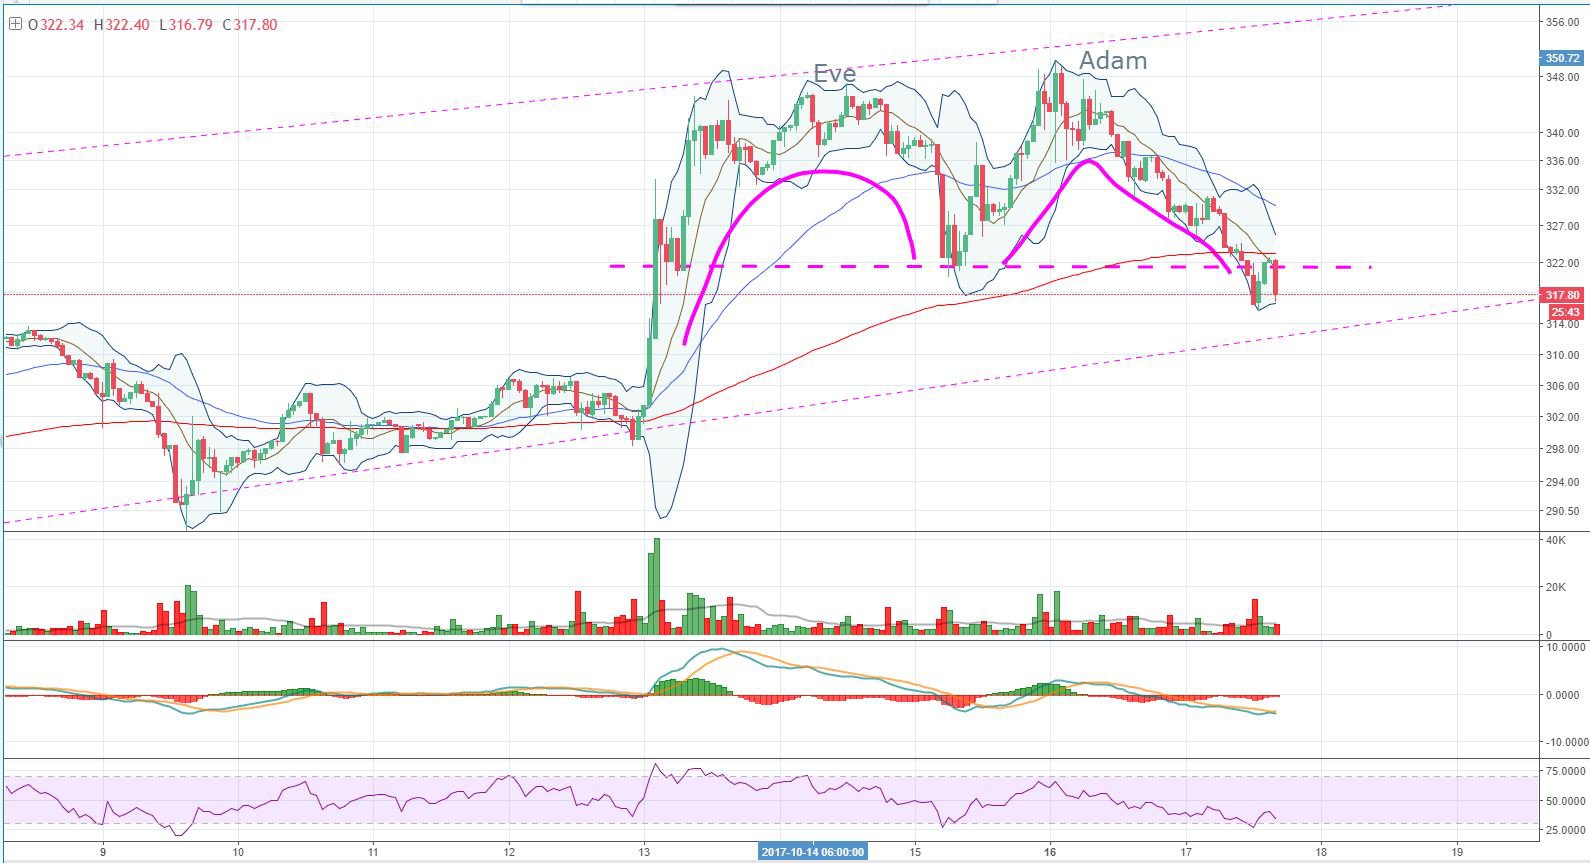 Figure 2: ETH-USD, 1-Hour Candles, Eve-and-Adam Double Top
At the time of this article, ether is attempting to break the neckline (the pink dashed line) of the massive reversal pattern. Should ether break this neckline, the measured move from this pattern is a $30 move downward, which would ultimately shove ether outside the bullish ascending channel it has been trending within. The price target of the Double Top breakout would bring the ETH-USD price into the upper $200s.
On a macro scale, ether has support along the following Fibonacci levels:
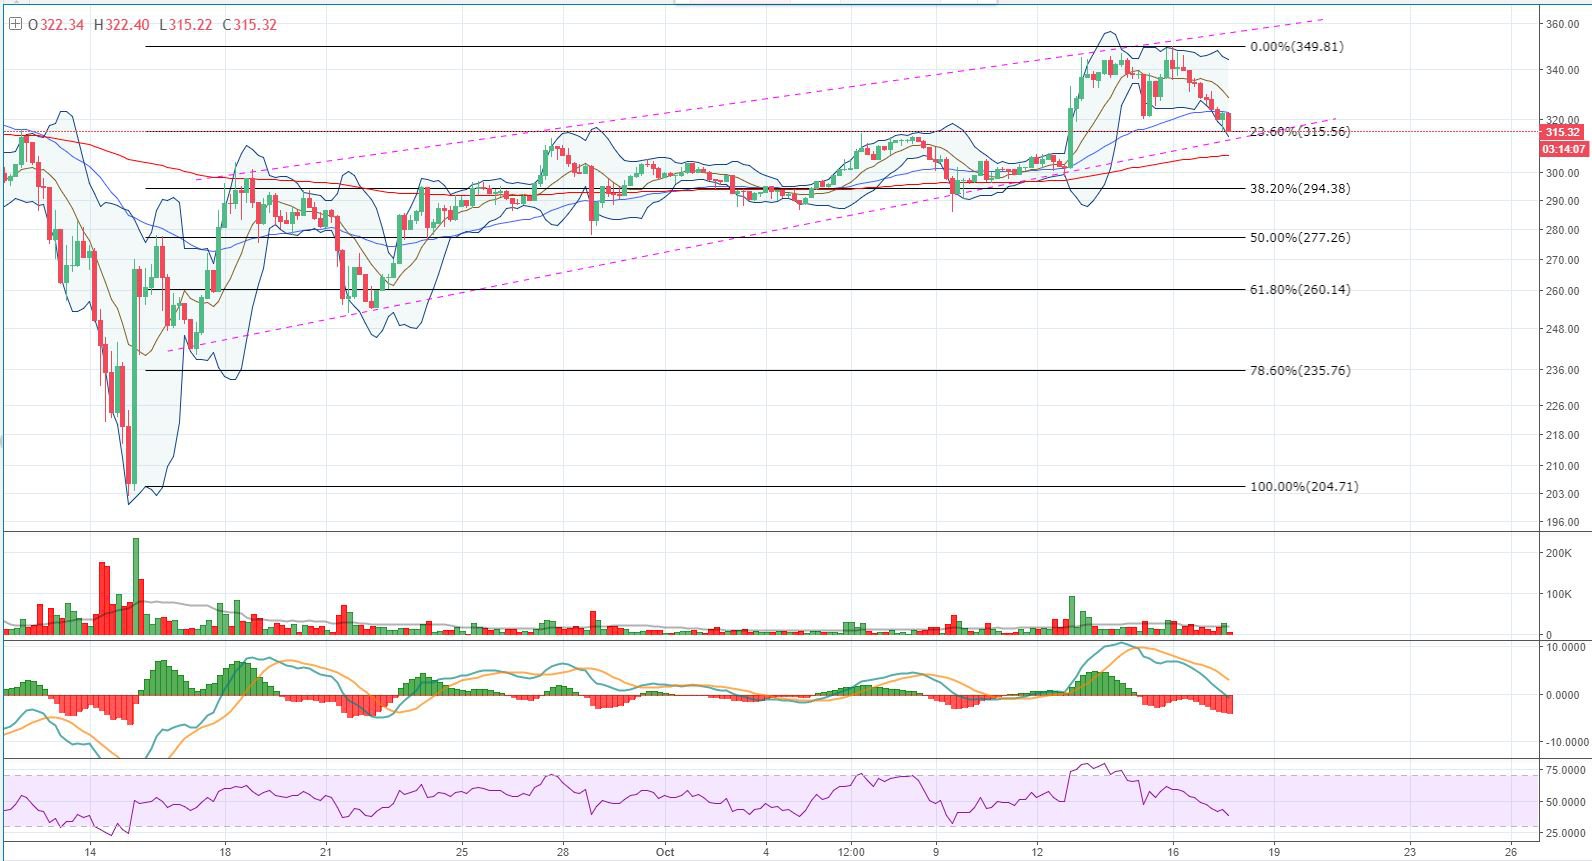 Figure 3: ETH-USD, 4-Hour Candles, Fibonacci Levels
Should the ascending channel break, the above Fibonacci levels will provide support and will need to be tested in order to prove a bearish continuation. As of the time of this article, the Double Top mentioned in Figure 2 is sitting right on the 23 percent retracement values where it is making attempts at breaking it. There is strong support at these values, so if ether can break and hold below $315, it will send a strong bearish signal to the market.
Should the Double Top complete, we can expect a test of the 38 percent retracement values following the break of the ascending channel. At this time, the 4-hour MACD is showing strong bearish momentum on a macro scale, and the market is picking up sell volume.
Summary:
-
For weeks, ether has been trending within an ascending channel.
-
Ether is currently in the process of making a strong test of the ascending channel via an Eve-and-Adam Double Top reversal pattern.
-
If the Double Top breaks downward, we can expect a break of the multi-week bullish channel and a test of the 38 percent Fibonacci Retracement values.
Trading and investing in digital assets like bitcoin, bitcoin cash and ether is highly speculative and comes with many risks. This analysis is for informational purposes and should not be considered investment advice. Statements and financial information on Bitcoin Magazine and BTC Media related sites do not necessarily reflect the opinion of BTC Media and should not be construed as an endorsement or recommendation to buy, sell or hold. Past performance is not necessarily indicative of future results.
The post Ether Price Analysis: Eve and Adam Could Be Turning Back the Bulls appeared first on Bitcoin Magazine.