Ether Price Analysis: Here’s What Just Went Down

A few days ago, just before a 25% market pullback, ETH-USD reached all-time high values upward of $420 as ICO investors desperately tried to accumulate ether to purchase Bancor tokens. The Bancor ICO was single-handedly responsible for congesting the Ethereum networks as users scrambled to get their ICO orders in time. This created a scenario where individuals were spending large sums of ETH to expedite their transactions and push other transaction times further and further back — the sheer volume of which could not be handled by many exchanges and wallets.
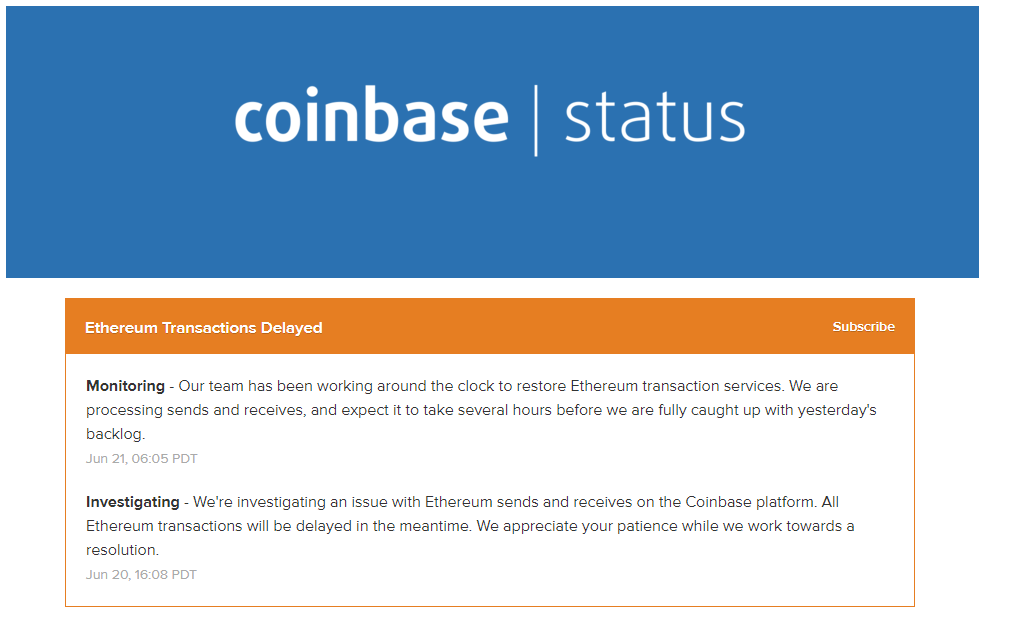
Figure 1: Coinbase Ethereum Transactions Delayed
Across multiple exchanges, messages like the one above began popping up yesterday as the perfect storm of ICO congestion from “Status” met a flood of ETH being sold off to BTC via the ETH-BTC markets (shown in yellow in the figure below). At the time of this article, the aftermath of the Status ICO is still being felt as many wallets and exchanges still have Ether-related services disabled.
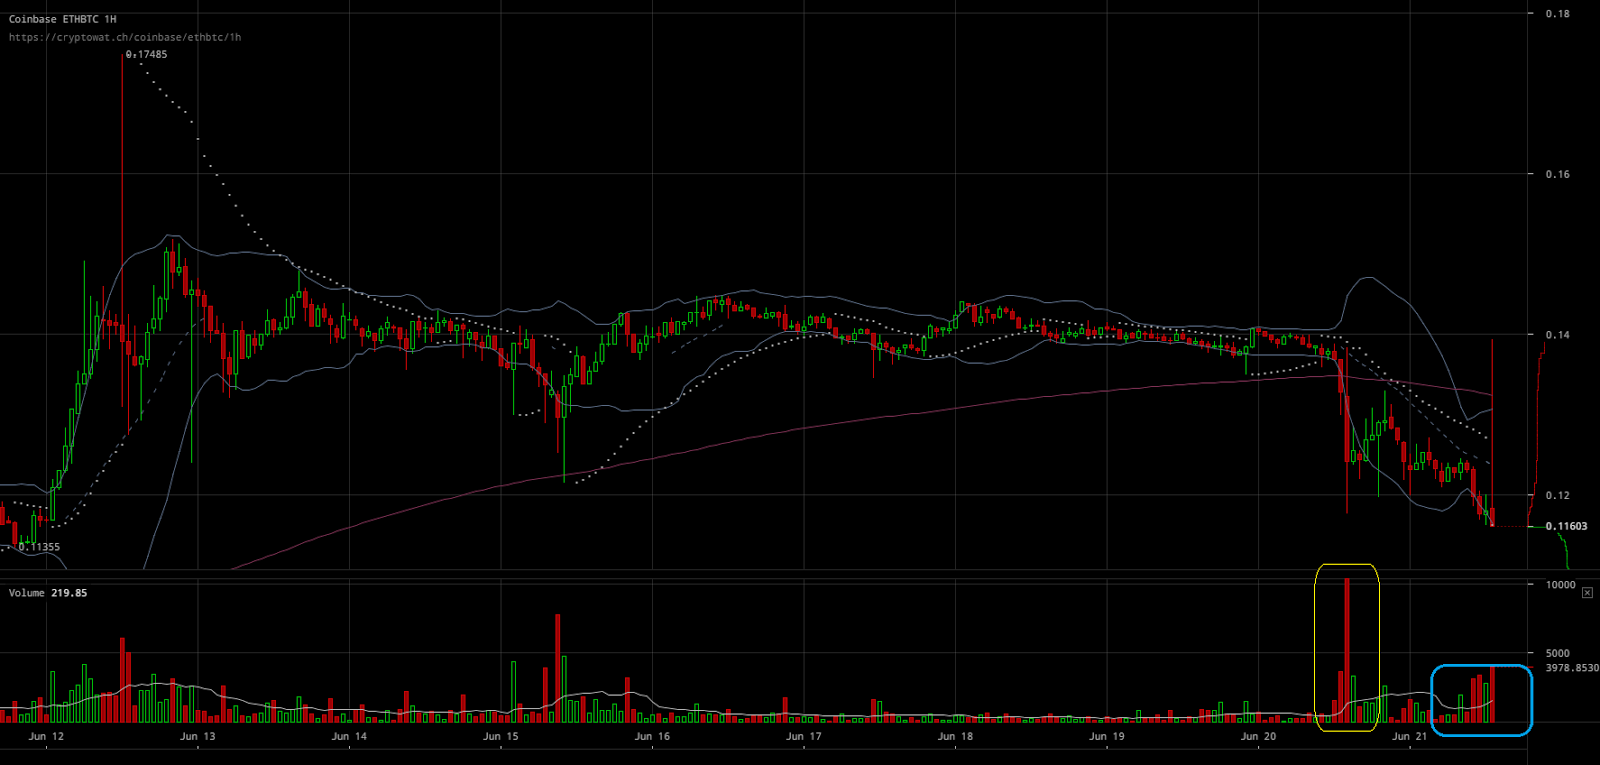
Figure 2: ETH-BTC, 1 HR Candles, GDAX
Once the services begin to open up and allow cold storage holders to get their coins on the market, one can only speculate how far the price will continue to be pushed down. Given the long-term, bearish indicators on the ETH-USD markets, it is entirely possible that we will see further tests of the lower support levels (shown in brown). The relatively low volume on this recent dip indicates the real price action has yet to truly begin. Because of the backlogged transactions from the Status ICO event, the volume we have seen thus far has mostly likely only been by those who held their coins on the exchange. The MACD and RSI (indicators of market momentum) are showing no sign of divergence (market momentum reversal) and there is very little upward pressure to keep the price aloft.
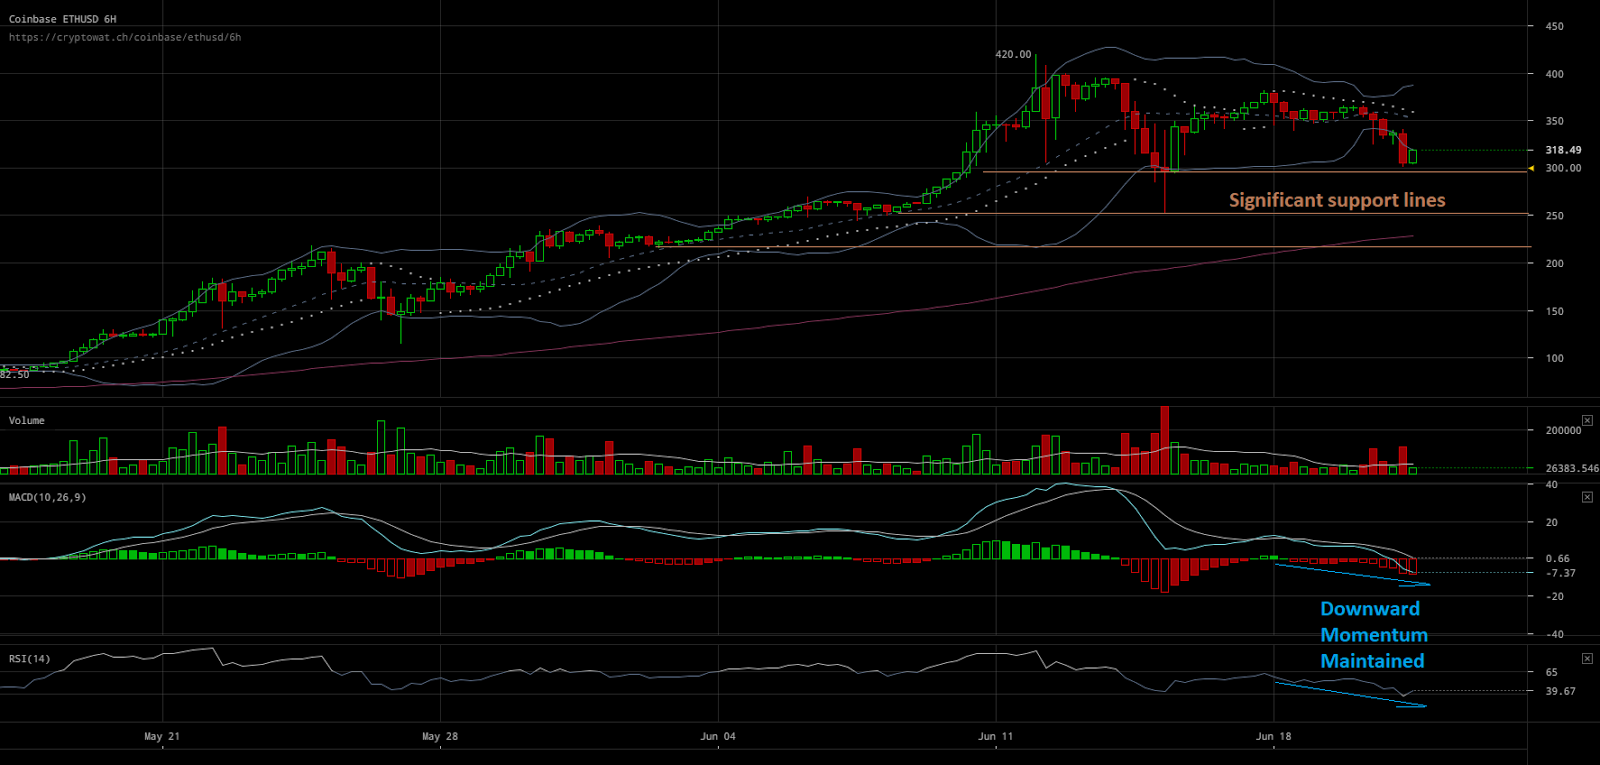
Figure 3: ETH-USD, 6 HR Candles, GDAX
Where the bottom of this bear run truly lies remains to be seen. However, for the first time since the double-digit values, the 1-day candles are showing a bearish trend on the MACD (shown in purple), and the RSI is showing a loss of momentum (divergence shown in orange). As it stands, ETH-USD is sitting on the first Fibonacci Retracement Line at ~$315 where it is flirting with the idea of lower values.
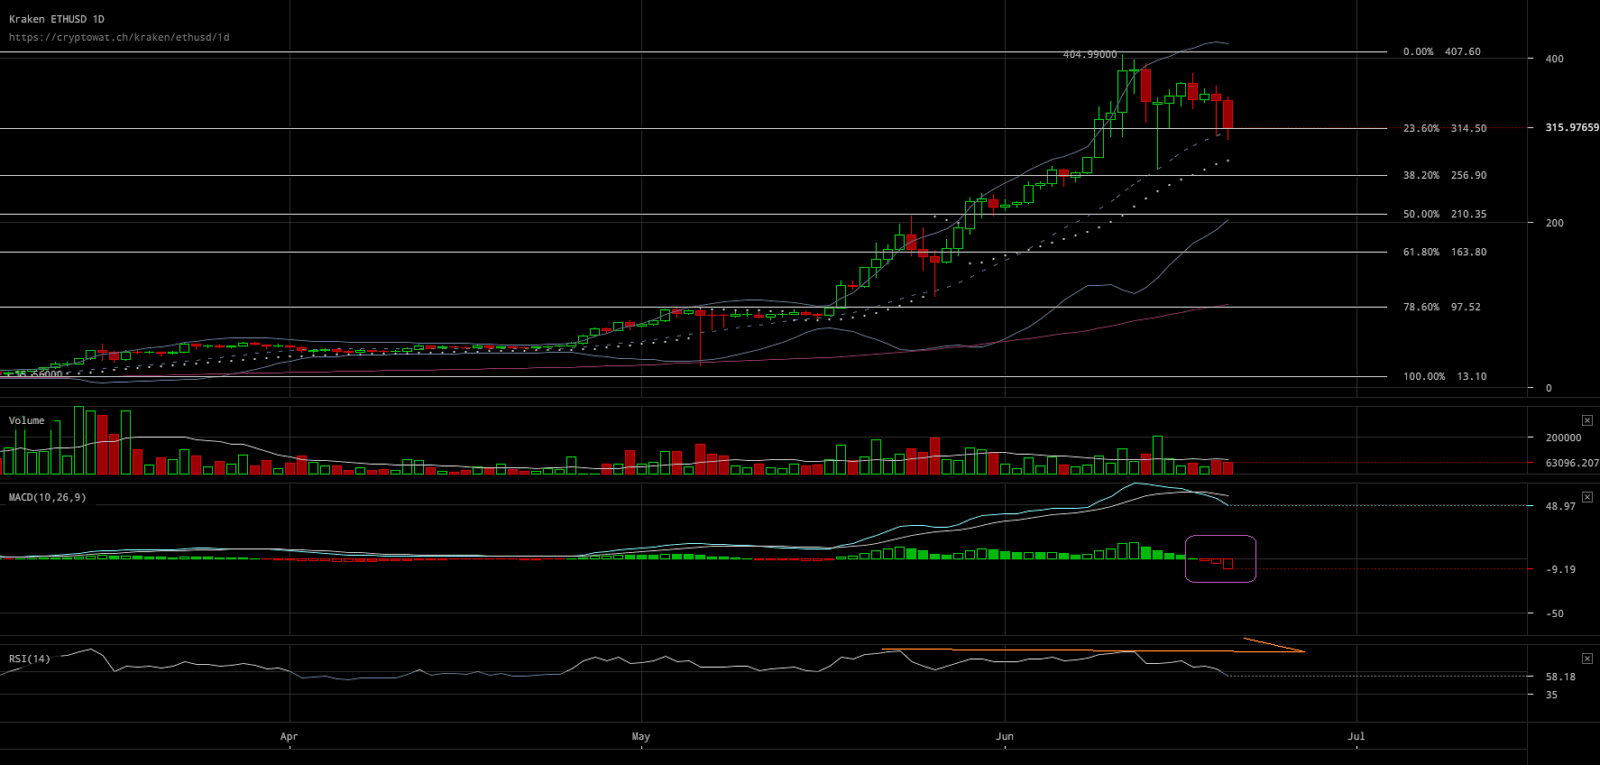
Figure 4: ETH-USD, 1 Day Candles, Kraken
Bancor and Status set record transaction volumes and accumulated millions of USD in the form of ETH. Is $300 the bottom of this Bear Run? Maybe. But one has to ask, “What would you do if you just had two of the largest ICOs in history, where the value of the ETH used to fund your project is at all time high values? Would you watch your capital dwindle away under bearish conditions, or would you cash out?”
Trading and investing in digital assets like bitcoin and ether is highly speculative and comes with many risks. This analysis is for informational purposes and should not be considered investment advice. Statements and financial information on Bitcoin Magazine and BTCMedia related sites do not necessarily reflect the opinion of BTCMedia and should not be construed as an endorsement or recommendation to buy, sell or hold. Past performance is not necessarily indicative of future results.
The post Ether Price Analysis: Here’s What Just Went Down appeared first on Bitcoin Magazine.