
Ethereum Price Technical Analysis for 24/12/2015 – Hope You Shorted!
Ethereum has plummeted more than 5% in the past 24 hours to touch a low of 0.00187BTC. Currently sustaining at 0.00192BTC, Ethereum does not provide a low-risk trading opportunity to the market participants.
But yes, those who would have followed our short advice in the previous Ethereum price technical analysis A Decisive Breakdown would have profited.
At the current level, I am compelled to put forth points which solidify my opinion that the ETH-XBT pair is in a “no-trade” zone. I will be drawing these points from the 4-h ETH-XBT price chart taken from KRAKEN exchange.
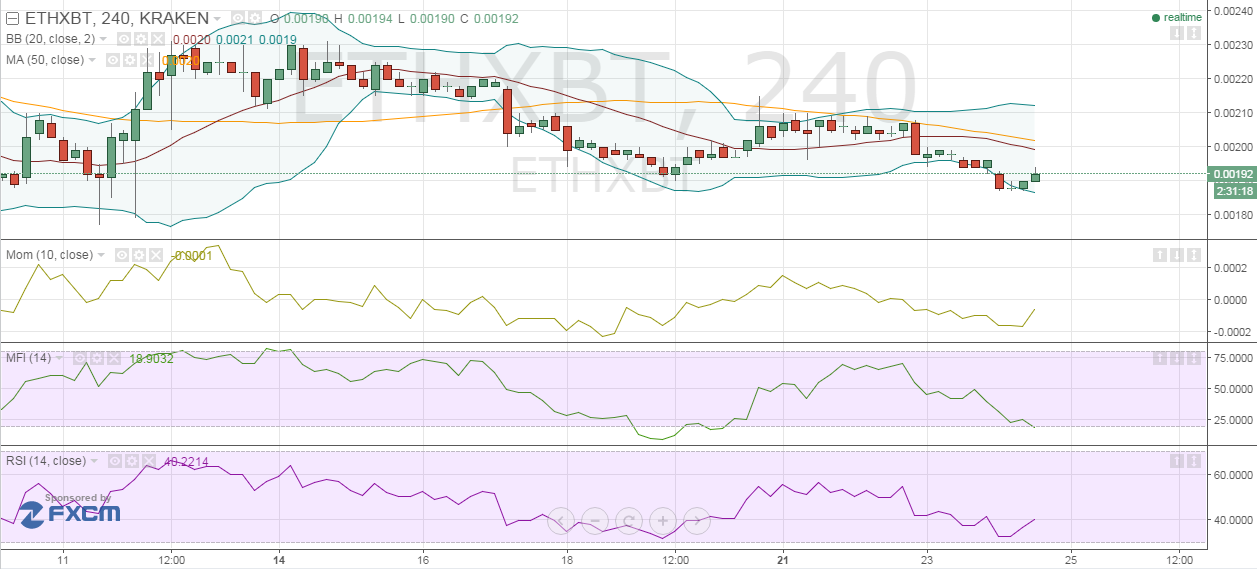
Chart Structure – The pair broke below the previous low of 0.0019BTC but is resisting further losses. I believe that a level near the strong support of 0.0018BTC will prove to be a better, more favorable trading opportunity for the bulls.
Bollinger Bands – The pair is staying afloat from the support lent by the lower range of the BB. A couple of moving averages i.e. the 50 4-h SMA and the 20 4-h SMA of 0.00201BTC and 0.00199BTC will act as a strong cap.
Momentum – The Momentum indicator is attempting a reversal as the price rises from lows. However, I would adopt a cautious approach and wait for a close above the 0-mark to build long positions.
Money Flow Index – The MFI is suggesting oversold conditions with a current value of 18.9032. But wait for lower readings as it looks weak enough to get more attractive.
Relative Strength Index – The 14 4-h RSI is 40.2214. Readings below 30 will indicate oversold conditions.
Conclusion
Ethereum can either move to 0.0020BTC (if short covering sets in) or drop to 0.0018BTC (if bearish momentum intensifies). But for a low-risk, high-reward trade, market participants should create positions near the extremes. High volatility is unlikely as the year comes to a close.
The post Ethereum Price Technical Analysis for 24/12/2015 – Hope You Shorted! appeared first on NEWSBTC.