
NEO, EOS, LTC, IOTA, Lumens: Technical Analysis March 27, 2018
According to statistics, 97% of all coins listed in the Top 100 list as per CoinMarketCap compilation are in the red. Ontology is the only gainer adding 12.56% while Bitcoin is down 8% trading below $8,000.
Basing our finding on price action, we expect further depreciation with EOS possibly reversing last week’s gains and LTC testing $100 or lower by week’s end.
Let’s have a look at these charts:
XLM/USD (Stellar Lumens)
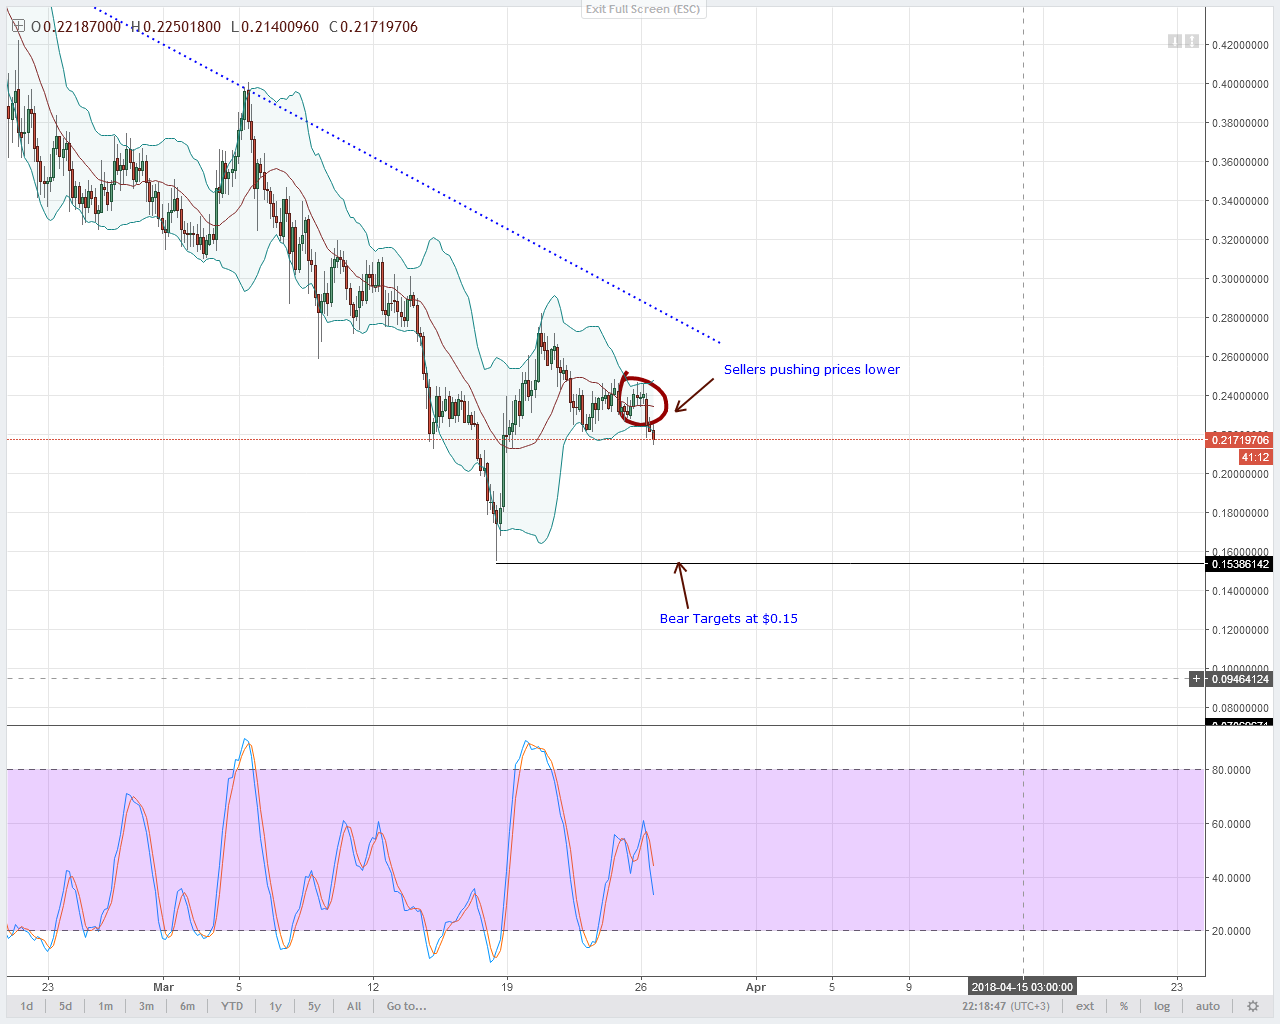
By press time, Lumens was down 9.23% according to CoinMarketCap statistics. Unfortunately, it seems like Stellar Lumens sellers are just getting started and gearing towards last week’s lows of $0.15.
This is just what the charts hints and coming at a time when Stellar Lumens is receiving awesome developments.
In my view, today sellers should look to ramp up their sells and trade according to the general negative outlay. If there are attempts of higher highs then $0.25 to $0.30 should be ideal sell zones.
IOT/USD (IOTA)
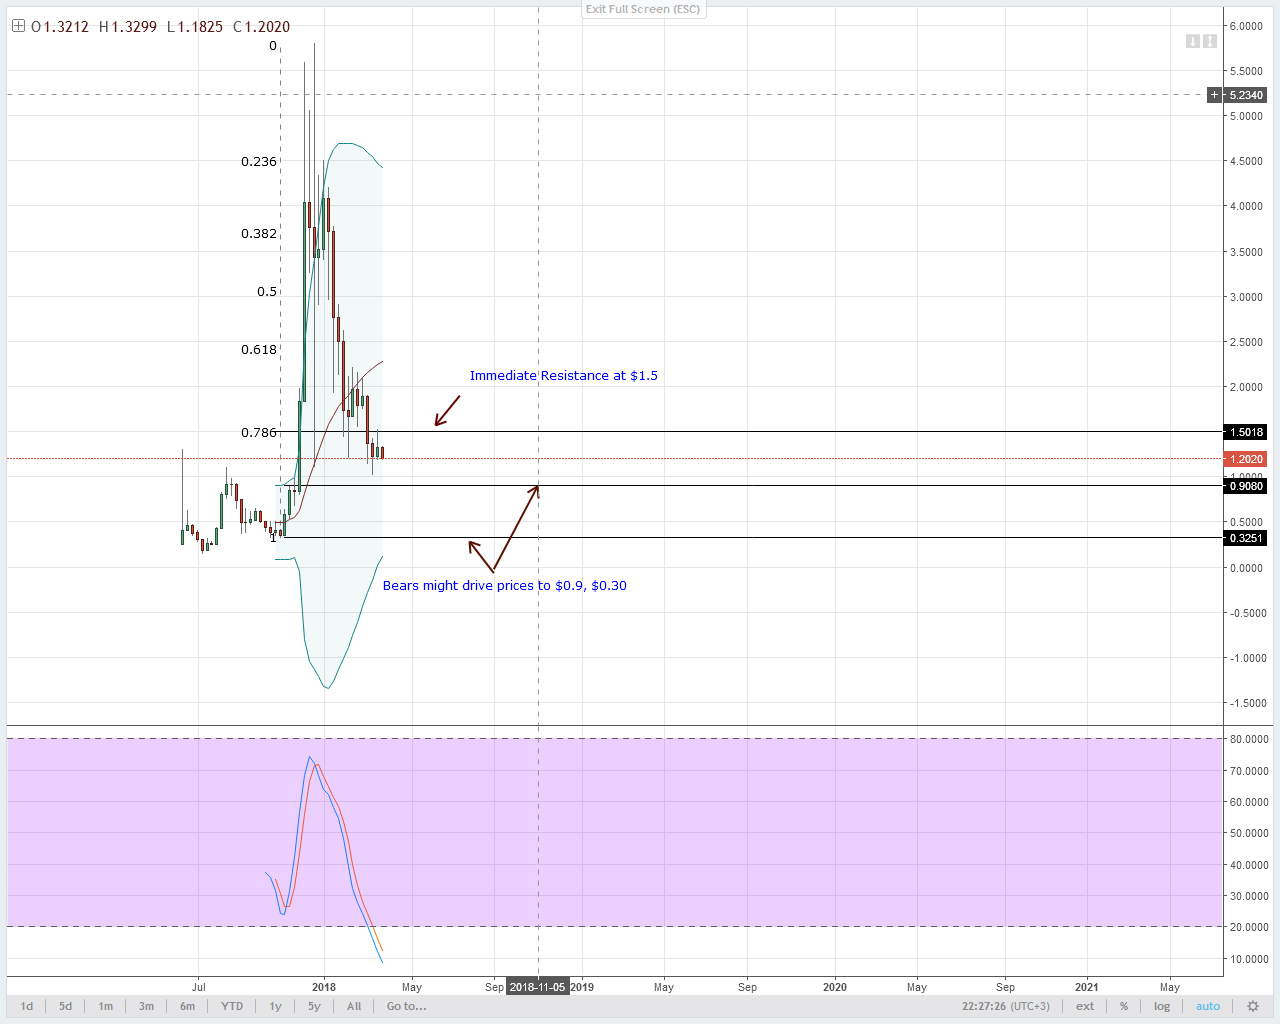
After yesterday’s price action, IOTA sellers are firmly on the driving seat. Because of this, chances of IOTA trading at parity with the USD remain high. Fact is IOTA might even trade lower if this sell pressure persists.
Stochastics in the weekly and 4HR charts are negative. Besides, we take a top down approach and prioritize price development in the weekly chart.
There it’s clear that not only can bears be overambitious and targets $0.85 but they can look forward for further erosion with the bull’s eye at $0.30. That’s October 2017 lows and the stem of Q4 IOTA rally.
EOS/USD (EOS)
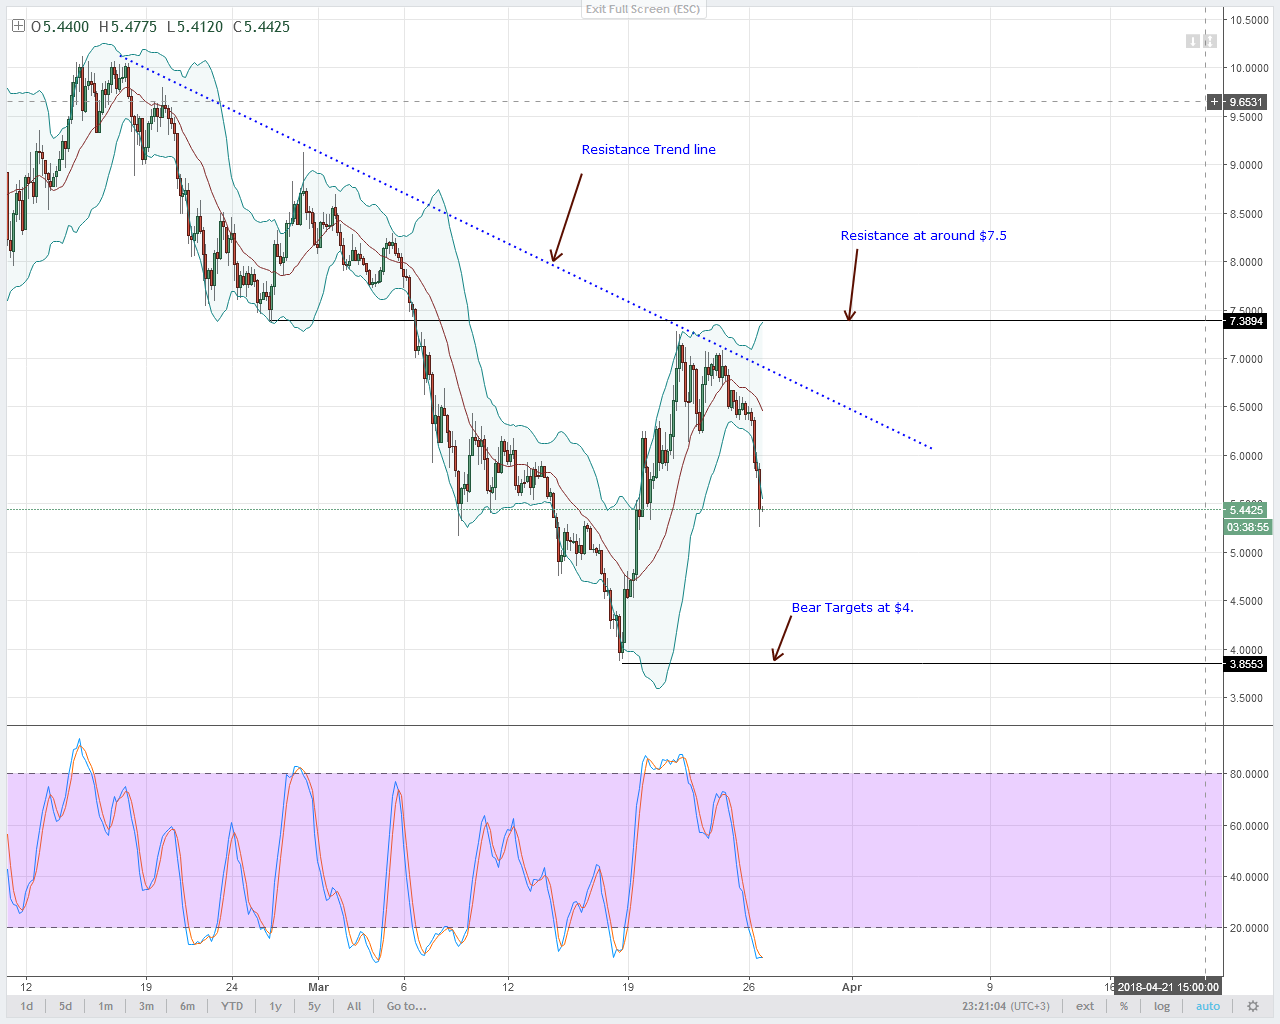
Sellers are on a rampage and to put things in perspective, EOS is down 18% in the last 24 hours and reacting from the resistance trend line. In my view, the degradation is just picking up momentum.
If we base our limits on price action then we can as well pick potential support or the ideal bear targets at $4. That’s March 18 lows and the foundation of last week’s 58% gain.
Not this though, if you want to trade this pair then it could help if you wait for stochastics sell signal to form in the 4HR chart before shorting.
Even if prices might recover, the current bear trend is only beneficial for those who are already in the trade. Anyway, any form of EOS recovery means sellers can stand by and wait for sell signals anywhere between $6.5 and $7.5.
LTC/USD (Litecoin)
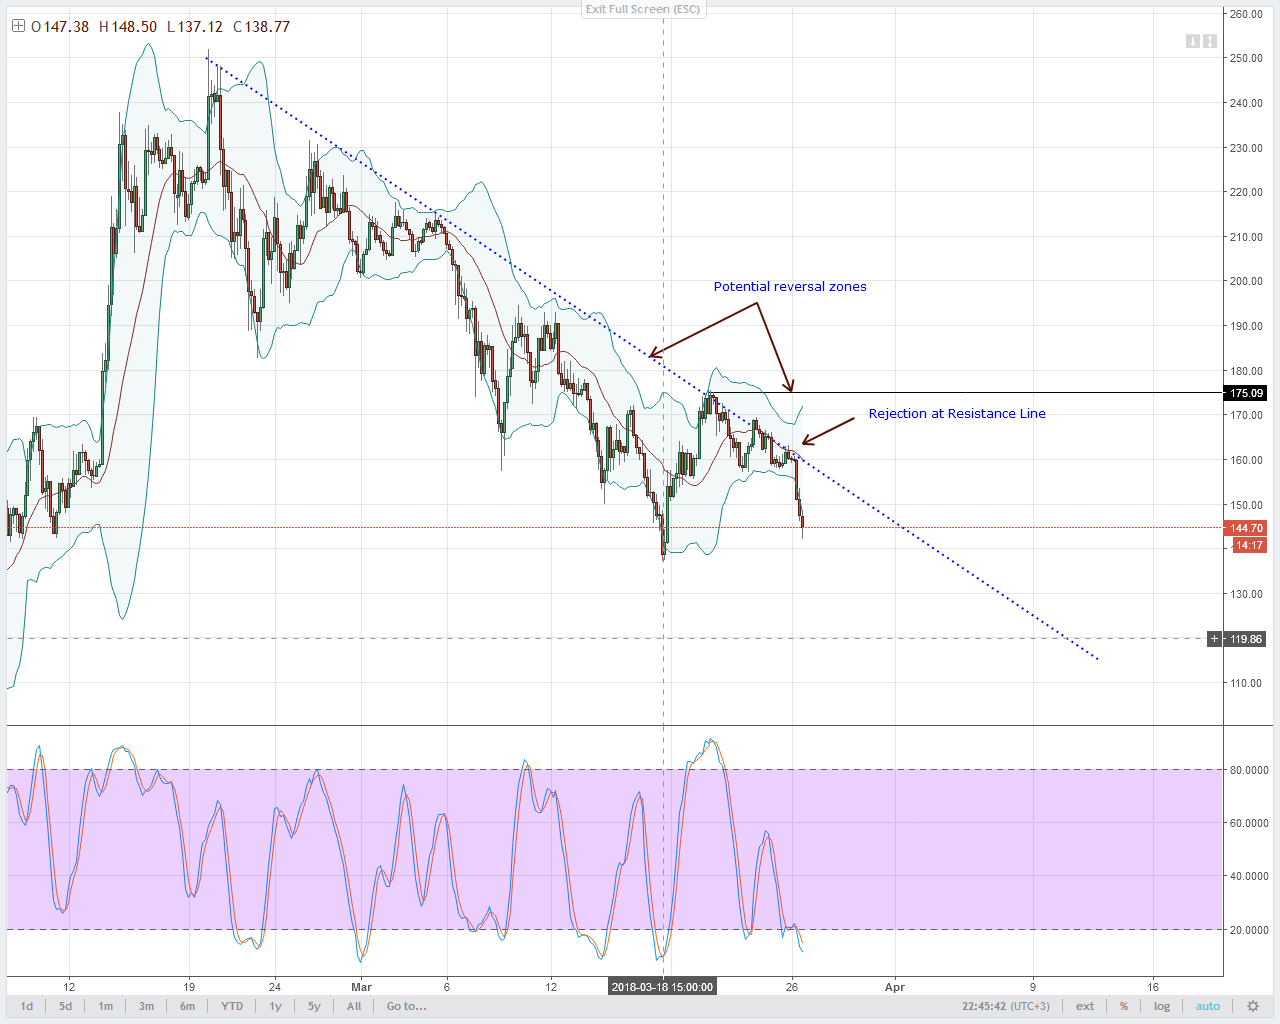
If we base our analysis from yesterday’s preview then we can see that prices are generally bearish and LTC bulls didn’t push prices above the resistance trend line. As such the series of bear candlesticks from the liquidation line is wonderful but sad from an investor’s perspective.
Zooming out and basing our analysis on the weekly chart, it’s evident that sellers are eye balling $90 or there about. Coincidentally, that’s the 78.6% Fibonacci retracement line.
Considering this bear momentum, it will not be rocket to project that if bears clears March 18 lows at $135, then $100 is an open goal even if LTC sellers may experience rejection along the way.
NEO/USD (NEO)
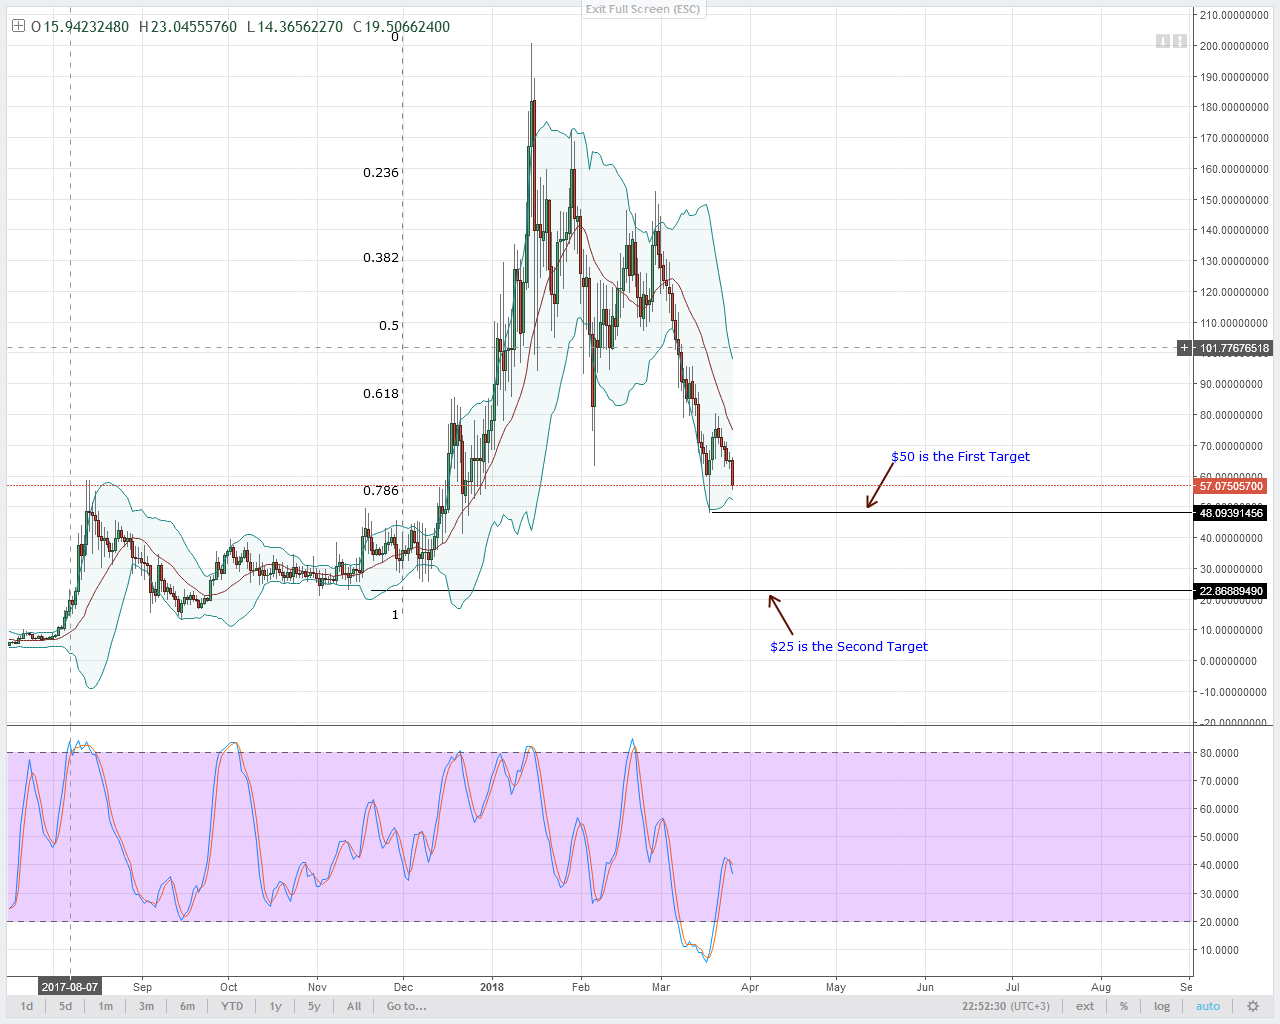
Initially, March 25 consolidation could have been a short term spring board for NEO prices but as price action means our stop loss was hit.
Overly, we remain bearish meaning traders should look for sell opportunities whenever it arises. Sometime bear target is $50 and any break below that then it’s likely that we might slide towards $25.
All BitFinex, Bittrex and CoinBase charts courtesy of Trading View
The post NEO, EOS, LTC, IOTA, Lumens: Technical Analysis March 27, 2018 appeared first on NewsBTC.