
The Federal Reserve Places Bitcoin Cash at $1800– That’s Where We Fix Our Buy Targets: Bitcoin Cash (BCH) Price Technical Analysis (June 1, 2018)
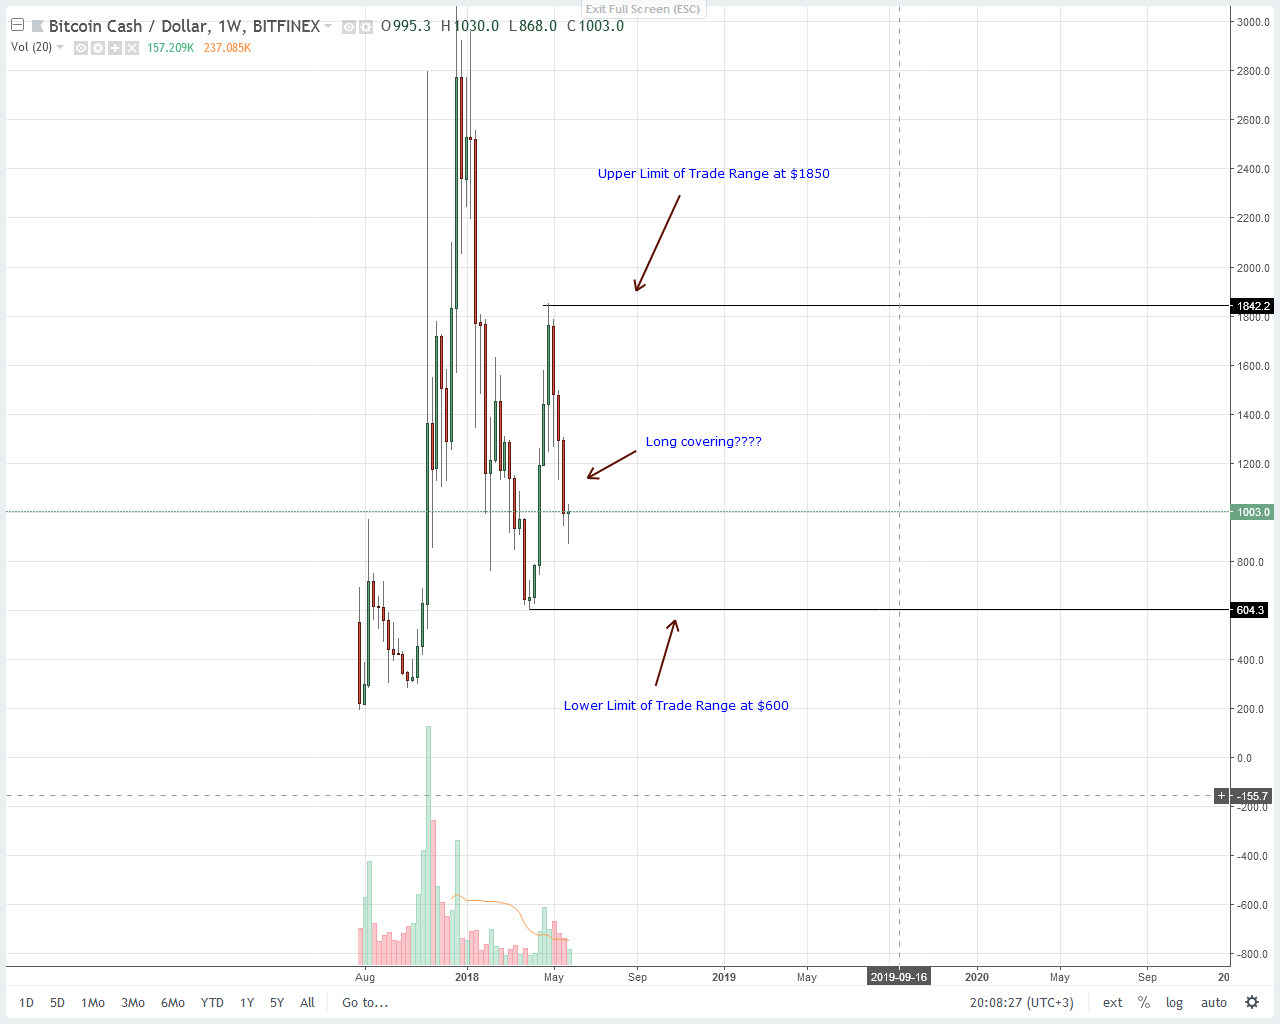
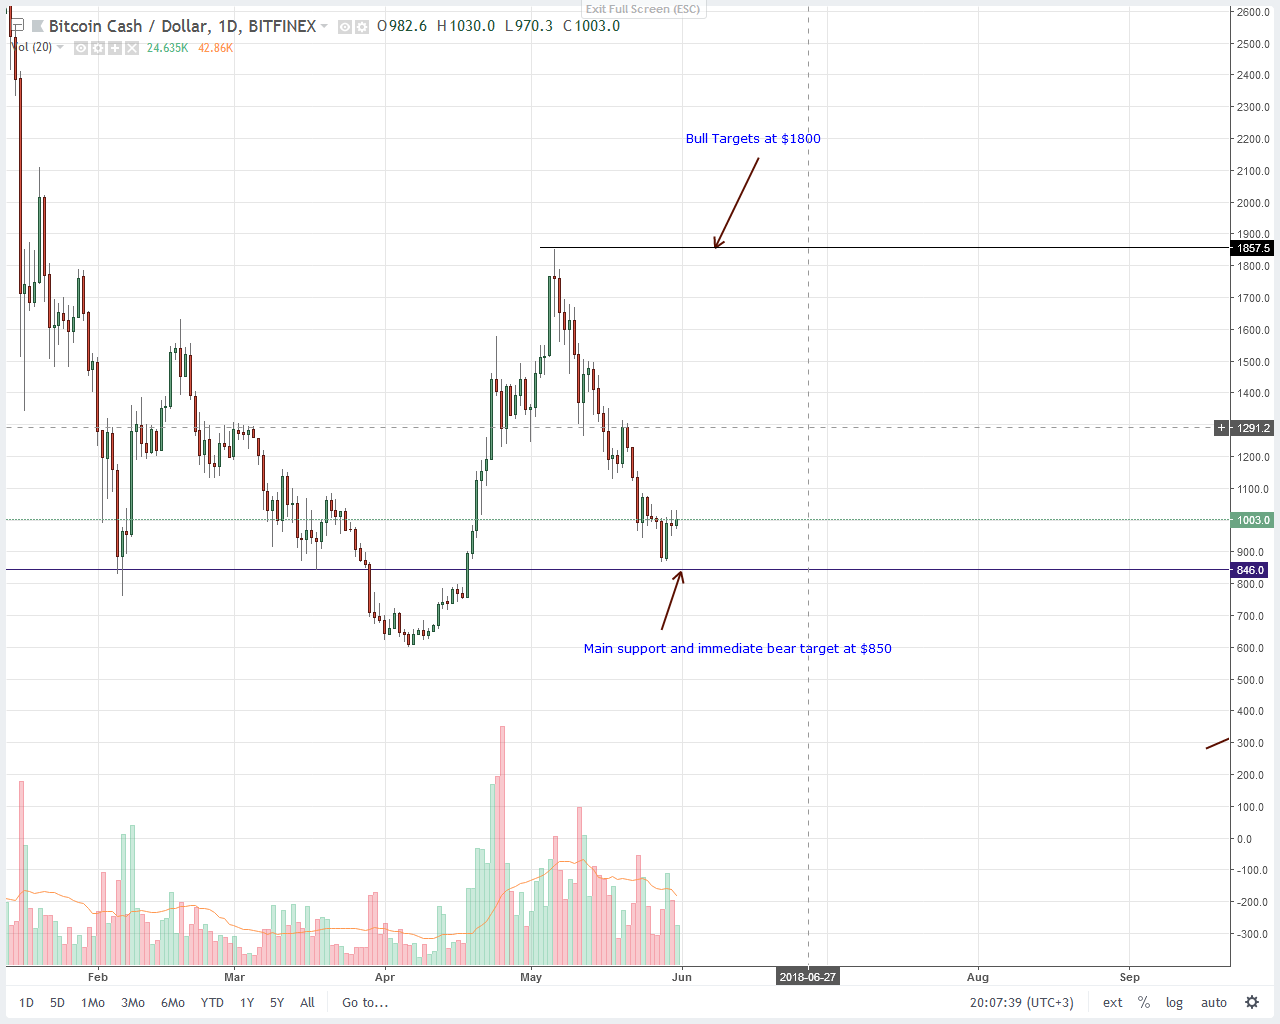
In the last 24 hours, Bitcoin Cash has been scaling up the bull ladder. It’s up two percent and odds are, BCH prices shall continue appreciating in the days to come. Fundamentals are good and despite their full node migration problems after their hard fork, Bitcoin Cash continues to take root. BCH is now available at De Vere and their users can now buy/sell the coins as they wish. All they have to do is download deVere mobile app and they are good to go. The genesis of current Bitcoin Cash squabbles can be routed back to August 2017 and the New York Agreement. Then, it was a couple of months before crypto-mania which saw main coins as Bitcoin and others exploding to their ATHs. During that pump, the network was literally congested and consequently, transaction fees were on the roof. To prevent such happenings, one of the agreements detailed a solution of lowering BTC network transaction fees. Segwit came to pass but Segwit2X collapsed in the last minute. Shortly after Segwit 2X failure, we had Bitcoin Cash. At its core and according to proponents, BCH represents the objectives of Satoshi himself. Two weeks ago, Bitcoin Cash did split again increasing their block size to 32 MB. They said they were preparing for a future in which they are dominant and are a medium of exchange if not a store of value. However, despite their objectives, there is a big problem. Statistics shows that up-to 13 percent of their full nodes didn’t upgrade and are effectively incompatible with the current PoW protocol. Whether this is a minor issue or not, we can truly say Bitcoin Cash is overlooking potentially disastrous situations which can be their major undoing. If they want to run the crypto world, then should have been consensus. In other news, can the recent depreciation of cryptocurrencies valuation be attributed to German officials dumping Bitcoin Cash, ETH and BTC? Solid data do support this argument. While we understand that price declines started in mid-January 2018, releasing of seized coins exacerbates the overall erosion of coin market cap. Reliable sources confirm that German authorities were successful in unloading 1399 Bitcoin Cash coins in 1600 individual transactions in a span of two months. Understandably, we can link this slide in market cap and Bitcoin Cash to the poor performance of the crypto market in May. It’s not an individual coin performance per say neither can critics satisfactorily point out a technical glitch or loss of user case application. Note this though, Bitcoin Cash bears are up 60 percent from April highs at around $1800. This is encouraging and portrays typical retracements following periods of higher highs we saw in April. In my view and considering the relation between trading ranges, volumes and key inflection points, I can almost conclude May down trend as long coverings. Then again, why not? Look at the way buyers are rejecting lower lows in lower time frames. It’s conditional that can only cement my views that last week’s sell candlestick was a climax if this week’s candlestick ends up bullish. In determining the most probable direction of price action, we can always refer to that double bar bullish reversal pattern on May 28-29. May 29 is important because it was this time that buyers did jump in. Check out those volume surges rejecting lower lows. The next day, prices didn’t edge higher and that is okay. However, after yesterday’s bullish candlestick, Bitcoin Cash buyers can look for under-valuations in lower time frame charts and trade with the trends. Ideal buy targets lie at $1,800 with stops at $900.From the News
Bitcoin Cash (BCH) Price Technical Analysis
Weekly Chart
Daily Chart
The post The Federal Reserve Places Bitcoin Cash at $1800– That’s Where We Fix Our Buy Targets: Bitcoin Cash (BCH) Price Technical Analysis (June 1, 2018) appeared first on NewsBTC.