Bitcoin Price Analysis: With August 1st Looming, Uncertainty is the Only Certainty

With only 3 days left before Bitcoin’s hardfork is implemented, there is still great uncertainty among BTC-USD markets (which inherently applies to all cryptocurrencies) and what their imminent fate will be. One would expect, with so much market uncertainty, that BTC-USD should be seeing dropping prices as people begin to sell their BTC in lieu of other fiat and crypto-assets. However, in a surprising turn of events, BTC-USD has managed to climb by over $300 within the past 24 hours. Because the speculations regarding the BTC hardfork vary wildly, this market analysis will look at the raw data presented on the markets and will not attempt to account for any of the hardforking ramifications.
Want to learn how to keep your bitcoins safe? Read this.
The figure below shows two indications that the BTC-USD climb is due for a consolidation period and possibly some pullback in price:
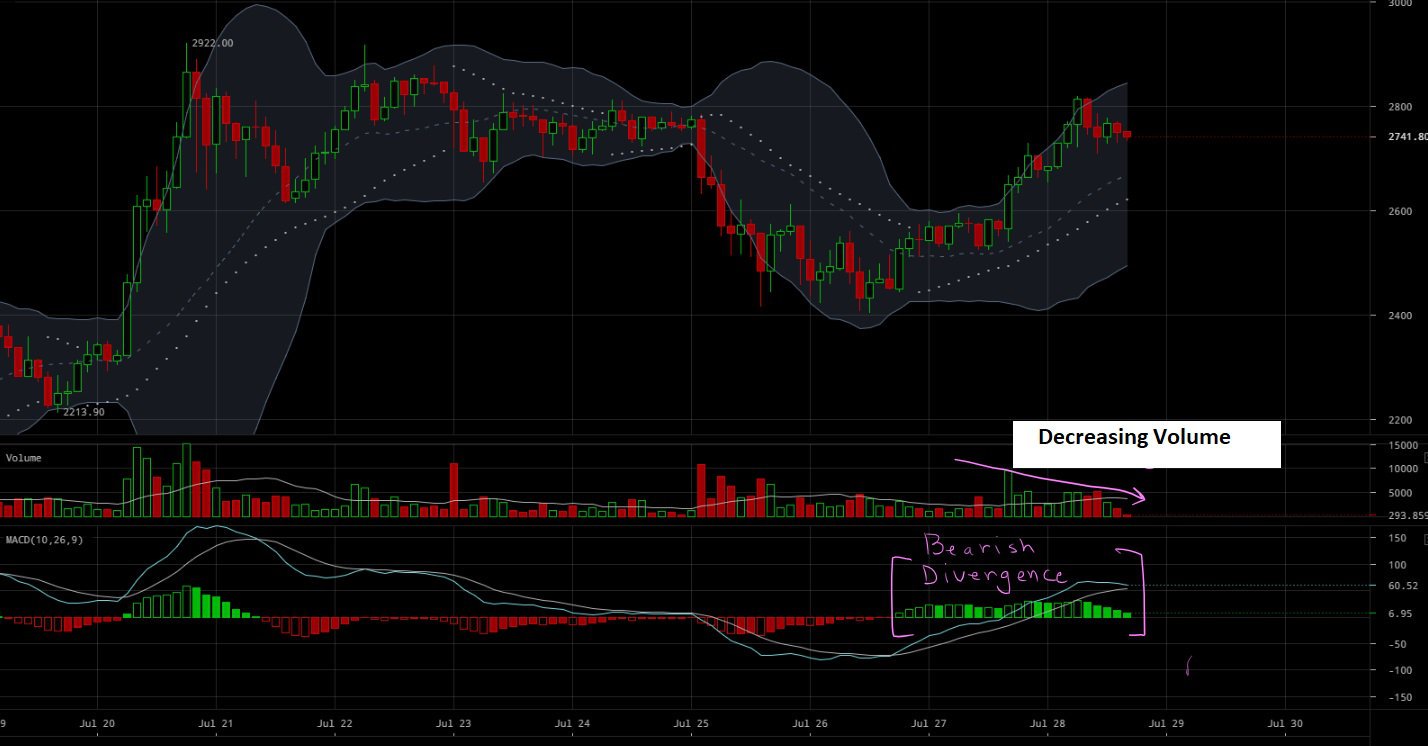 Figure 1: BTC-USD, 2HR Candles, Bitfinex, Momentum Loss
The first that stands out with the current $300 rise is the decreasing volume throughout the length of this little bull run. Decreasing volume indicates the decrease in market interest in these higher values and typically leads to either a consolidation period or a pullback in price to garner support from lower values.
The second indicator that stands out is the 2HR MACD divergence shown in pink. Typically, for a healthy bull run to sustain its upward momentum, we would like to see the MACD making new highs on the histogram to accompany the new highs in market value. Looking closely, you can see the most recent high of approximately $2800 did not correspond to a new high on the MACD histogram. Thus, another indicator of market momentum loss reveals the increased likelihood of market price consolidation.
As always, it is important to put the current market trend within the context of the grand picture:
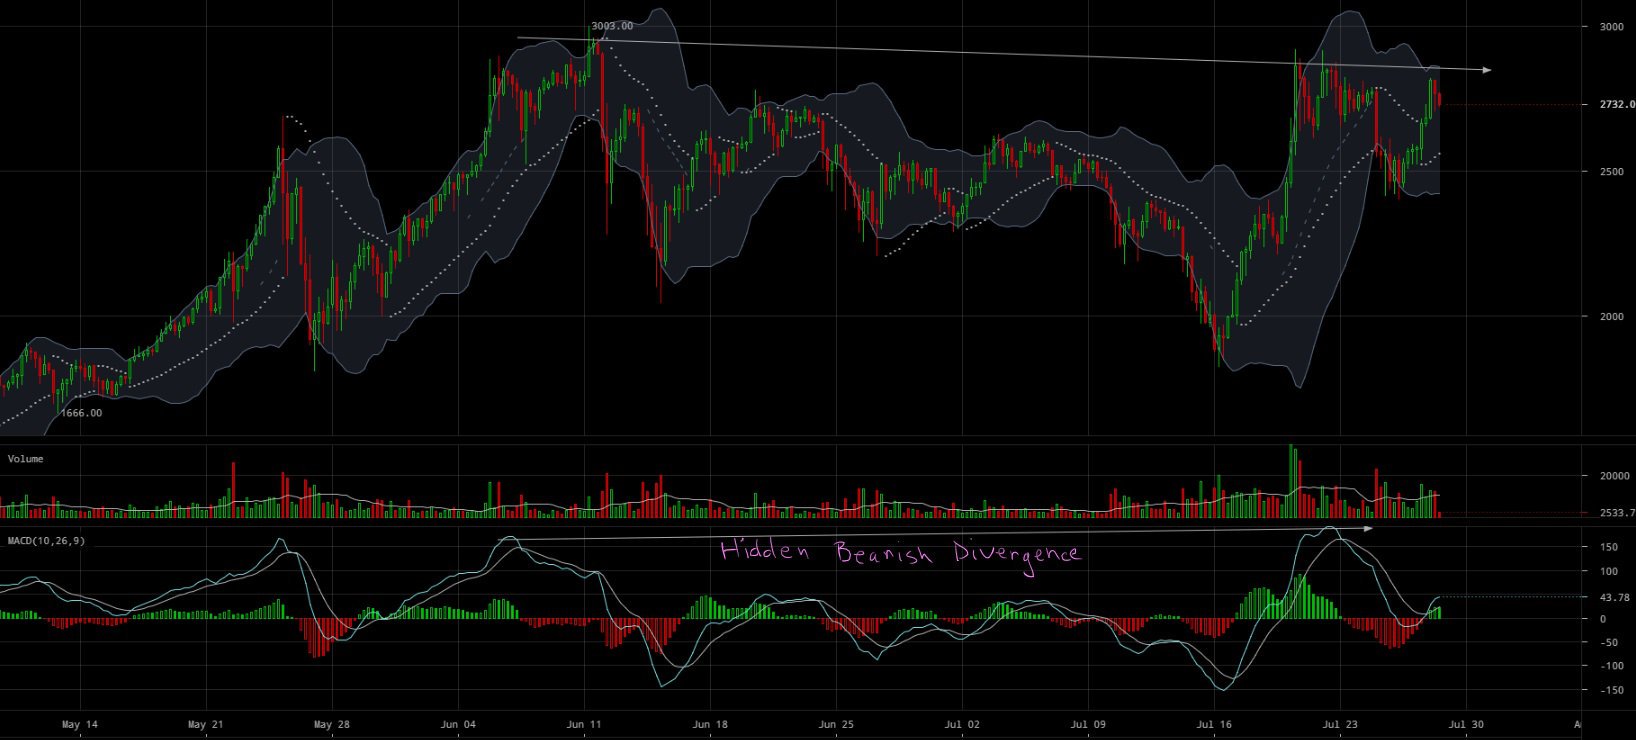 Figure 2: BTC-USD, 6HR Candles, Bitfinex, Hidden Bearish Divergence
Looking at the 6HR candles trend, there is a subtle hint of macro bearish divergence on the MACD. When the MACD signal line/moving average makes a new high, but the price trend does not make a new high, this can be an indication of bearish leaning momentum called “hidden bearish divergence.” In addition to the MACD hidden bearish divergence, we can see a severely decreased volume trend as we approach the highs made a couple weeks ago. In general, the upper $2000s seem to be a battleground that is starting fizzle out in a bearish fashion. This could be attributed to many factors, but ultimately I think the wild price swings can be easily explained by the great uncertainty in the market surrounding the August 1st hardfork.
With only 3 days left, speculators are getting situated in their positions. Until the hardfork is implemented, there is no telling what will happen to the BTC-USD markets or the cryptomarket as a whole. So, with all this uncertainty in the air, where can we expect to find levels of support in the event of a major crash on August 1st? The figure below shows the key support levels to look for on the macro scale:
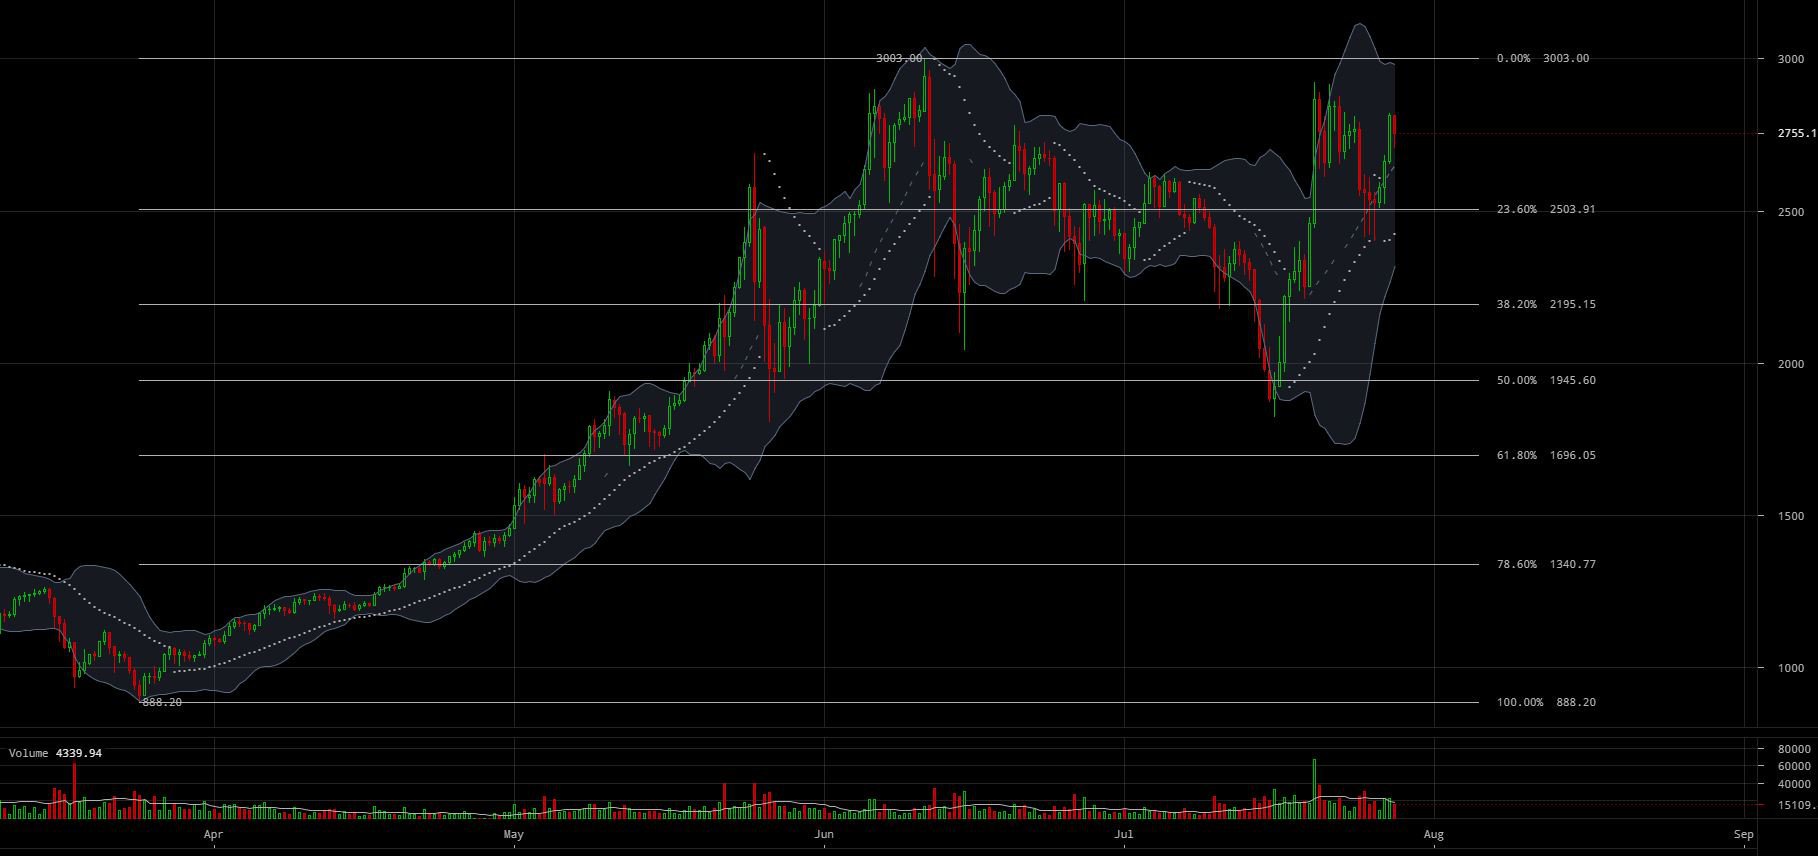 Figure 3: BTC-USD, 12HR Candles, Bitfinex, Key Support Levels
Once again, the key support levels for the macro trend are found along the Fibonacci Retracement values of the entire bull run. Immediately below our current values lies very solid, historic support at $2500 values. A test of this support value will ultimately dictate the immediate future of the BTC-USD market.
On the run up to $2900 a couple weeks ago, a lot of volume went into the market to develop firm support. A breakdown of this support level could prove to be quite destructive to the BTC-USD market in the short term. The $2500 support level is clearly shown in the massive influx of volume and proves to be a severe point of market interest. To date, that is one of the strongest support levels BTC-USD has established, as indicated by the rise in volume around those prices.
Summary:
-
On the macro and micro levels, BTC-USD is showing indications of price consolidation in the near future.
-
Key support levels are found along the Fibonacci Retracement values. In particular, $2500 has proven its historical significance in the market and should be closely watched in the event of a bear run post-hardfork on August 1st.
Trading and investing in digital assets like bitcoin and ether is highly speculative and comes with many risks. This analysis is for informational purposes and should not be considered investment advice. Statements and financial information on Bitcoin Magazine and BTC Media related sites do not necessarily reflect the opinion of BTC Media and should not be construed as an endorsement or recommendation to buy, sell or hold. Past performance is not necessarily indicative of future results.
The post Bitcoin Price Analysis: With August 1st Looming, Uncertainty is the Only Certainty appeared first on Bitcoin Magazine.