
Ethereum Price Technical Analysis – Downside Acceleration
Ethereum Price Key Highlights
- Ethereum price moved down further and traded below the last week’s low to set a new low of 0.00251BTC.
- There is a bearish trend line formed on the hourly chart, acting as a hurdle for buyers in the short term.
- There is a risk of more losses, as sellers look in control of the situation.
Ethereum price continued to weaken as the price fell to a new low of 0.00251BTC where buyers appeared.
Can Sellers Remain in Control?
There was a lot bearish pressure noted on the Ethereum price recently, which took the price towards 0.00250BTC. There were a couple of nasty spikes noted around the stated level, but every time sellers attempted to break it buyers appeared to prevent the downside. The price is currently correcting higher, but facing a resistance around a bearish trend line formed on the hourly chart of the Ethereum price. The price is also below the 100 hourly simple moving average, which is a sign that sellers are in control in the short term.
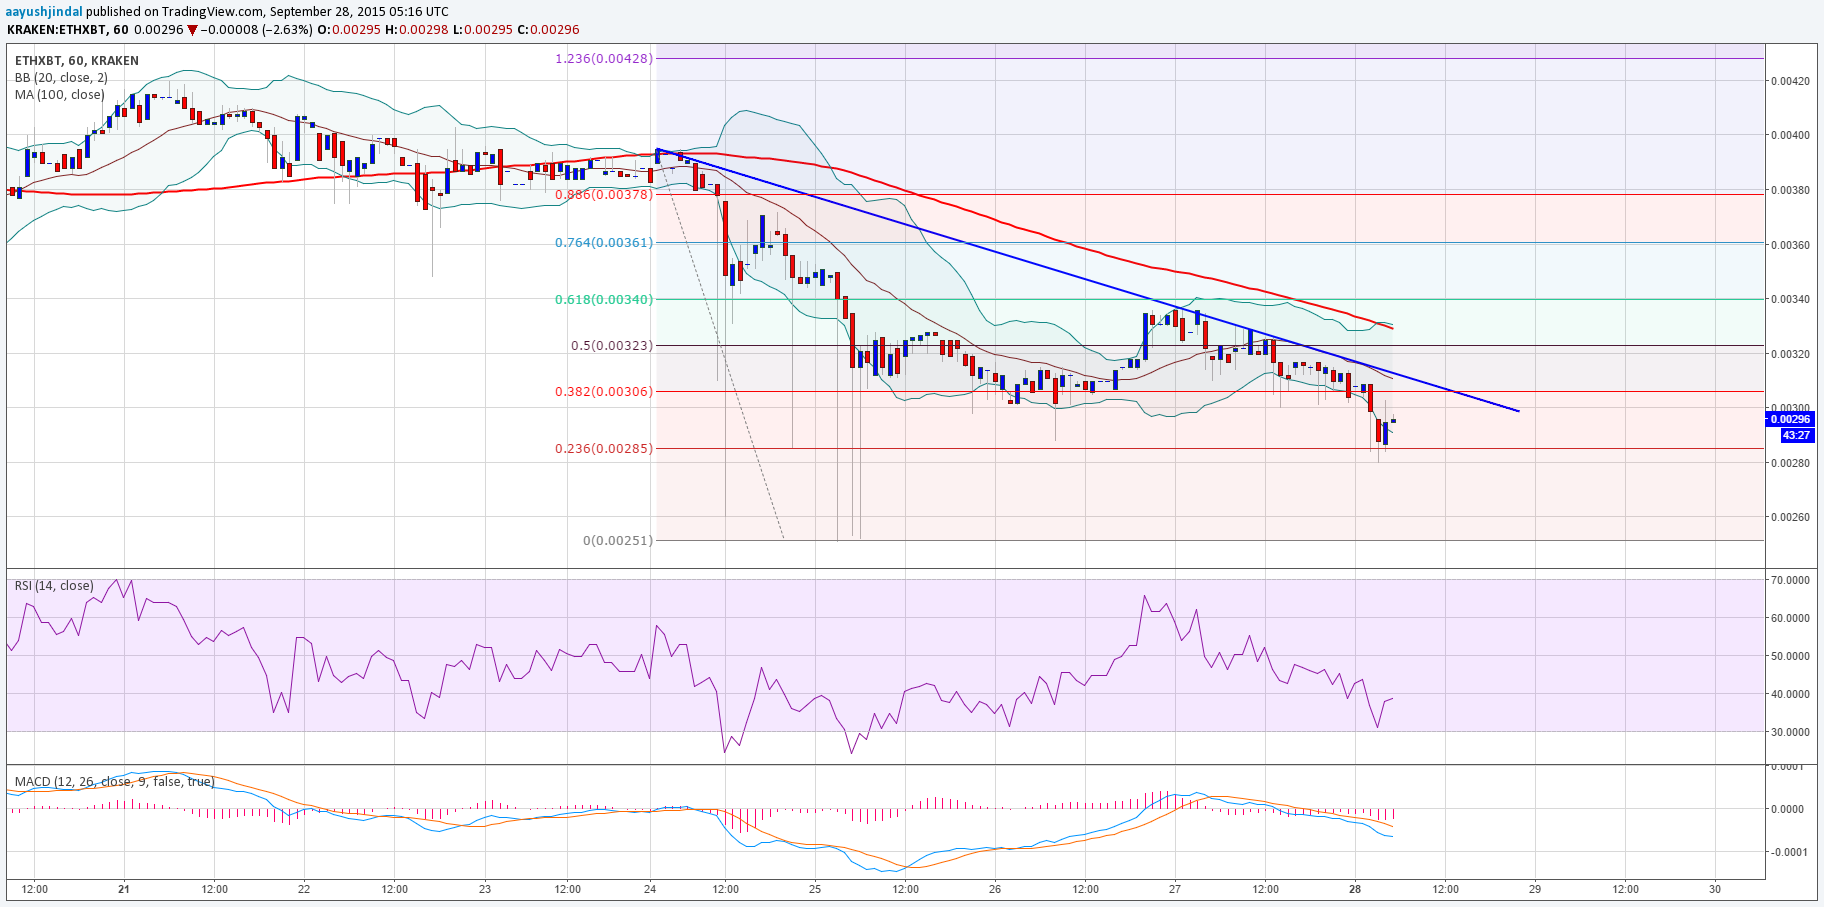
If the price corrects higher from the current levels, then the highlighted trend line and resistance area might come into play. It is also coinciding with the 38.2% Fib retracement level of the last drop from 0.00395BTC to 0.00251BTC. So, a break above it might be difficult. However, if buyers manage to clear it, then the most critical 100 hourly MA might come into play. Any further gains could be challenging, as there is a major resistance formed around 0.00320BTC
On the downside, the last low of 0.00251BTC is a support area, which if broken may take the price towards 0.00248BTC.
Intraday Support Level – 0.00251BTC
Intraday Resistance Level – 0.00320BTC
The hourly RSI is around oversold levels, which means there is a chance of an upside move.
Charts courtesy of Trading View
The post Ethereum Price Technical Analysis – Downside Acceleration appeared first on NEWSBTC.